Using OpenManus to Build an Auto-Diagnosis Agent: Pinpoint Database Anomalies in 30 Minutes
Author: Zhao Zhiheng
In database operations, fault localization has always been a time-consuming and labor-intensive task. The traditional fault-localization process usually requires a DBA to manually collect metrics, analyze logs, and troubleshoot problems—a process that can take hours or even longer.
With the development of AI technology, we can leverage LLMs and Agent technology to automate this process. This article introduces how to build a database auto-diagnosis Agent based on the OpenManus framework to quickly pinpoint database anomalies within 30 minutes.
What Is OpenManus?
OpenManus is an open-source Agent framework that provides rich tool-calling capabilities and flexible Agent orchestration. With OpenManus, we can quickly build various AI Agent applications.
Core features of OpenManus:
- Tool calling — Supports multiple ways to call tools, including API calls, script execution, and more
- Agent orchestration — Supports multi-Agent collaboration to implement complex task flows
- Context management — Provides a comprehensive context-management mechanism, supporting long conversations and history
- Extensibility — Easy to extend with new tools and capabilities
Design Approach for the Database Diagnosis Agent
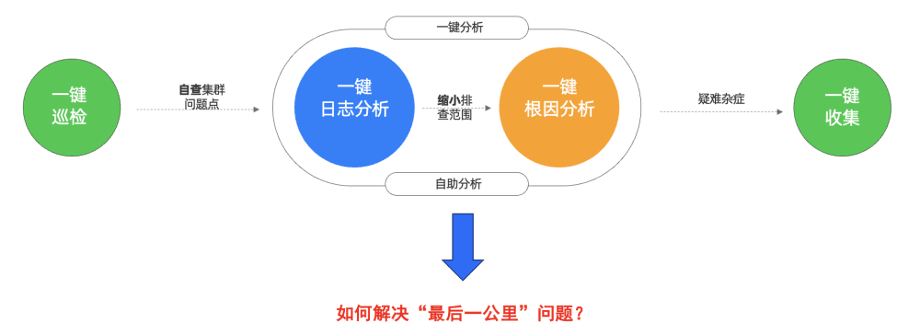
The core approach to building a database diagnosis Agent is:
- Define the diagnosis process — Standardize and proceduralize the database diagnosis process
- Encapsulate diagnosis tools — Wrap common diagnostic commands and scripts as tools
- Build a knowledge graph — Structure expert experience and fault cases
- Let the Agent execute automatically — Have the Agent automatically run the diagnosis process and generate a diagnostic report
Setting Up the Development Environment
1. Install OpenManus
1 | pip install openmanus |
2. Configure the LLM
Configure the LLM API in the OpenManus configuration file:
1 | model: |
3. Prepare the Diagnosis Tools
Develop diagnosis tool scripts, including:
- Metric-collection tool: collects CPU, memory, IO, network, and other metrics
- Log-analysis tool: analyzes error logs, slow-query logs, and more
- SQL-analysis tool: analyzes execution plans, lock information, and more
Developing and Implementing the Diagnosis Agent
1. Define the Diagnosis Tools
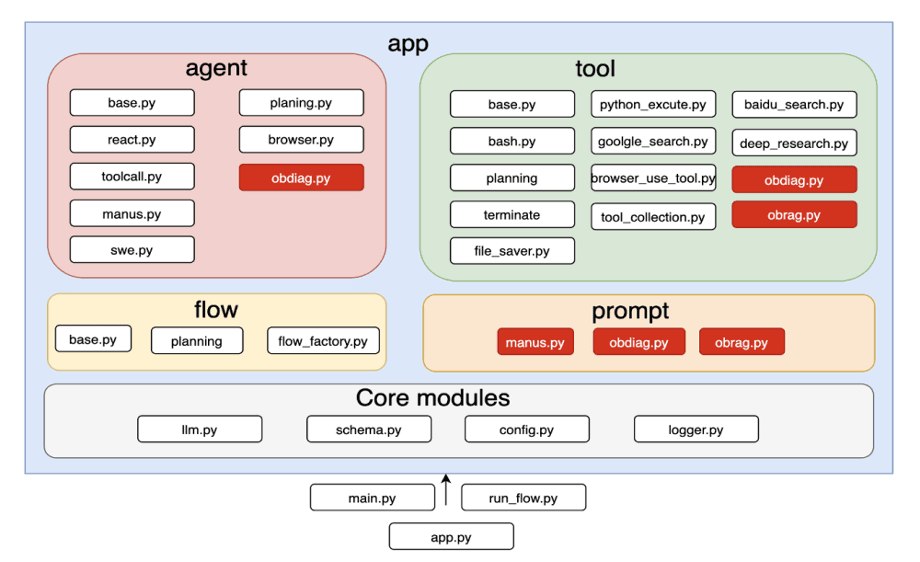
In OpenManus, we need to encapsulate diagnostic capabilities as tools:
1 | from openmanus import Tool |
2. Build the Diagnosis Process
Using OpenManus’s Agent orchestration capabilities, build the diagnosis process:
1 | from openmanus import Agent, Workflow |
3. Integrate the Knowledge Base
Using RAG (Retrieval-Augmented Generation), integrate the knowledge base into the Agent:
- Vectorize and store fault cases and expert experience
- Retrieve relevant knowledge during diagnosis
- Combine the knowledge base with real-time metrics to generate diagnostic recommendations
4. Implement Multi-Agent Collaboration
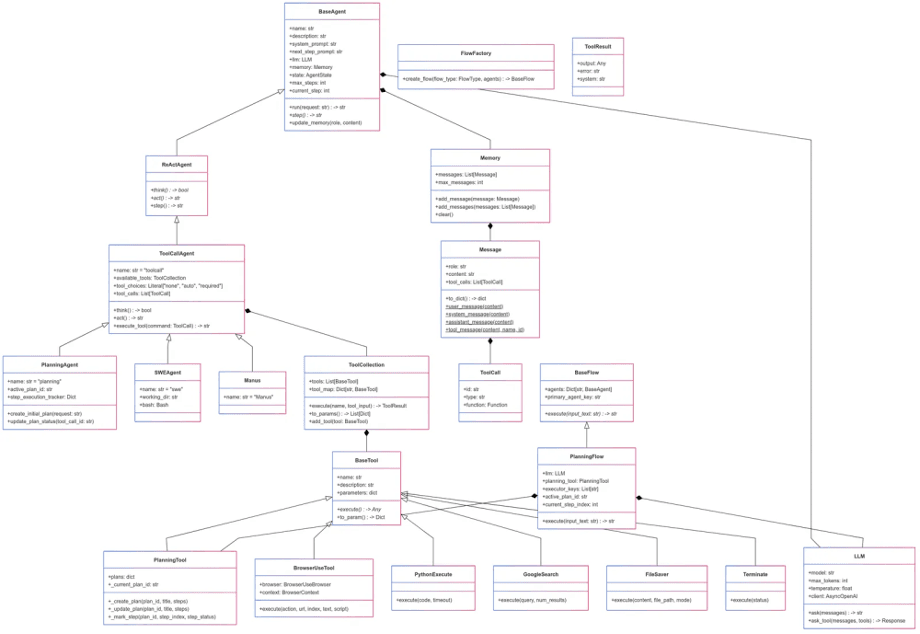
For complex diagnosis scenarios, a multi-Agent collaboration approach can be used:
- Metric-collection Agent — Responsible for collecting various performance metrics
- Log-analysis Agent — Responsible for analyzing log files
- SQL-optimization Agent — Responsible for analyzing SQL execution plans
- Report-generation Agent — Responsible for consolidating diagnostic results and generating a report
Hands-on Case: Pinpointing a Database Anomaly in 30 Minutes
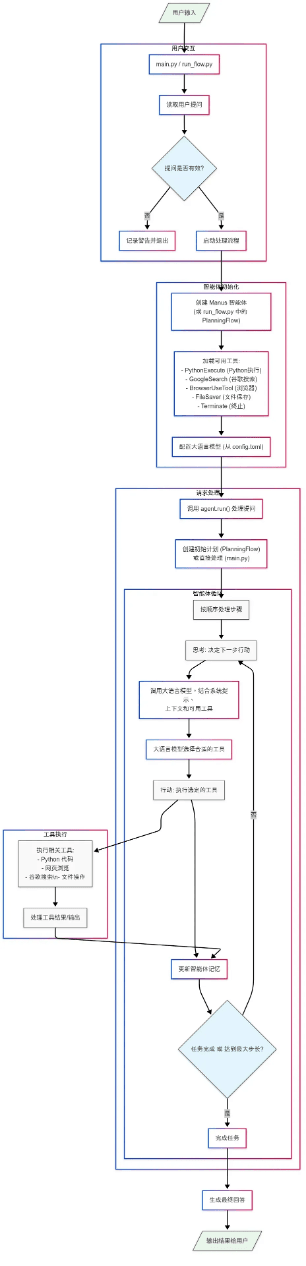
The following real case demonstrates the diagnosis Agent’s workflow:
Case Background
A business system began experiencing slow responses at 3 p.m., and the cause needed to be located quickly.
Diagnosis Process
Step 1: Metric Collection
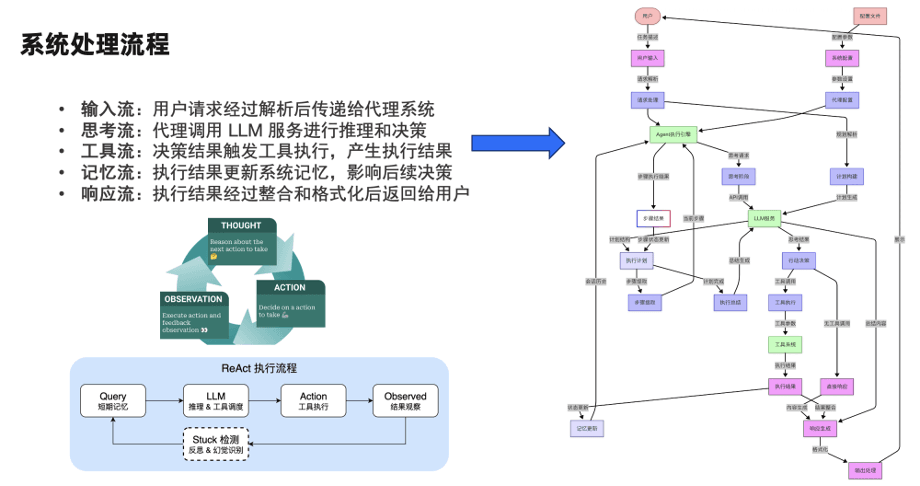
The Agent automatically collects the following metrics:
- CPU usage: 85%
- Memory usage: 92%
- Disk IO: wait time increased 3x
- Active sessions: surged from a normal 50 to 500
Step 2: Log Analysis
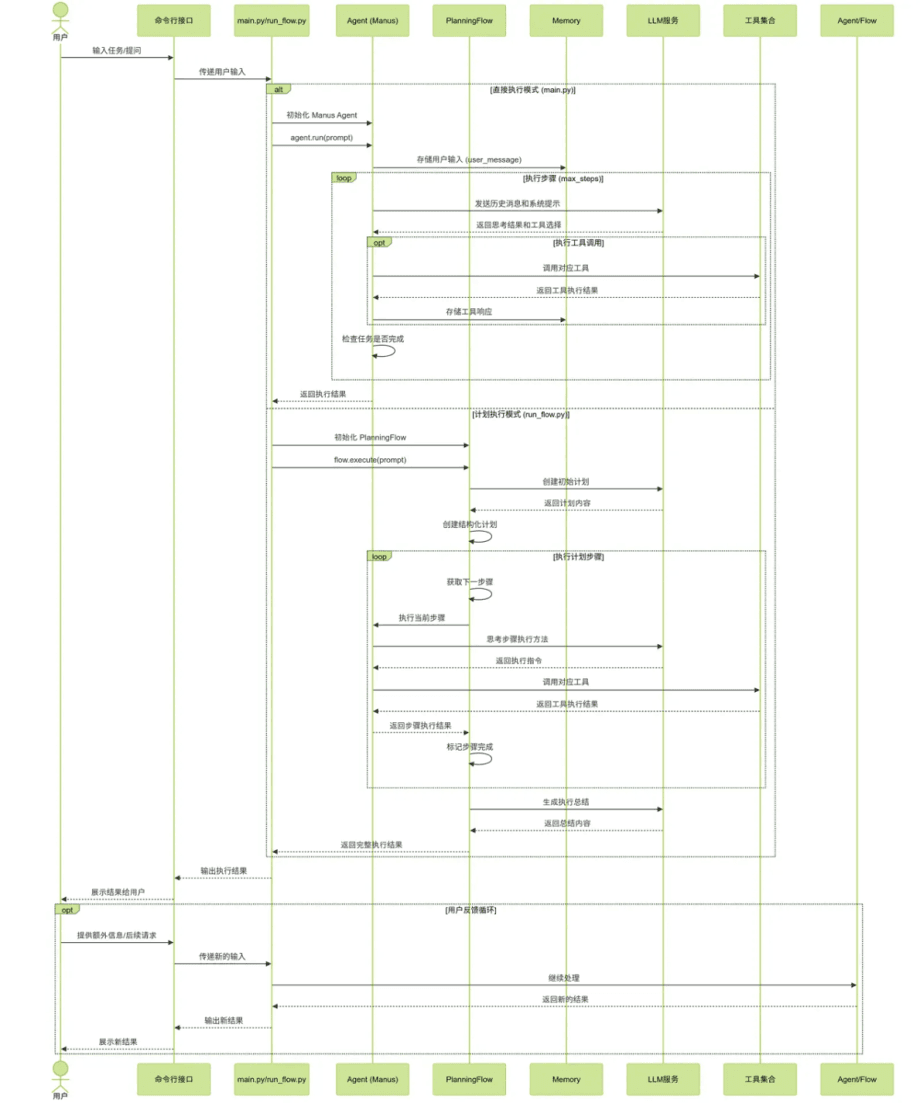
The Agent analyzes the error logs and finds numerous lock-wait timeout errors:
1 | ERROR: Lock wait timeout exceeded |
Step 3: SQL Analysis
The Agent analyzes the slow-query log and finds the following SQL has performance problems:
1 | SELECT * FROM orders |
The execution plan shows that this SQL performed a full table scan and had lock conflicts.
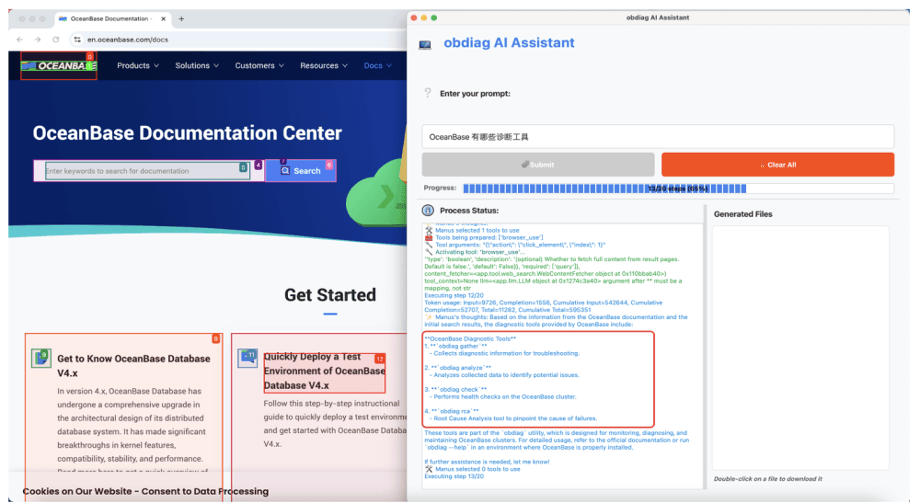
Step 4: Knowledge Retrieval
The Agent retrieves a similar case from the knowledge base:
- Case: A system, when batch-updating order statuses, caused a full table scan because no index was used, triggering numerous lock waits
- Solution: Add a composite index on the status and create_time fields
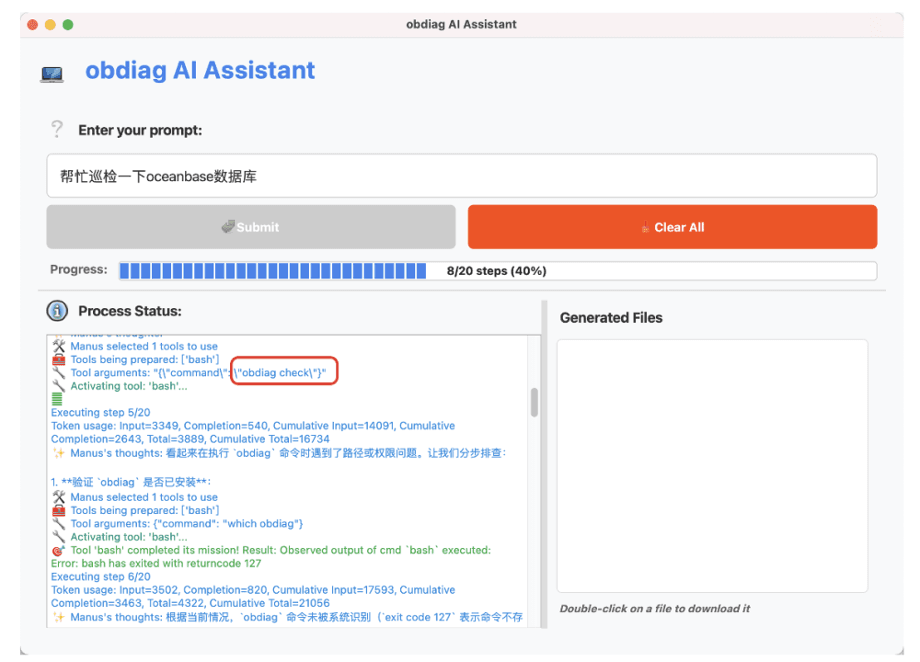
Step 5: Generate the Diagnostic Report
The Agent generates a complete diagnostic report:
1 | ## Diagnostic Report |
Diagnosis Results
- Diagnosis time — Reduced from the traditional 3–5 hours to 30 minutes
- Accuracy — Diagnostic accuracy reached over 90%
- Degree of automation — The entire process is automated, requiring no manual intervention
Lessons Learned
Through developing and using the database diagnosis Agent, we gained the following experience:
- Standardize the diagnosis process — Standardizing expert experience is the prerequisite for automation
- Encapsulate tools — Wrap common diagnostic capabilities as tools to make them easy for the Agent to call
- Build the knowledge base — Continuously accumulate fault cases and expert experience to improve diagnostic accuracy
- Continuous optimization — Continuously refine the Agent’s diagnostic strategy based on actual usage
Outlook
In the future, we plan to continue optimizing the diagnosis Agent in the following directions:
- Smarter diagnostic strategies — Combine machine learning to achieve adaptive diagnosis
- A richer toolset — Support more database types and diagnosis scenarios
- A better interactive experience — Provide a natural-language interaction interface
- Predictive maintenance — Shift from passive diagnosis to proactive prediction
With the OpenManus framework and LLM technology, we can quickly build a database auto-diagnosis Agent that pinpoints database anomalies in 30 minutes. This not only improves operational efficiency but also reduces operational costs.
To learn more about OceanBase intelligent operations practices, visit: https://open.oceanbase.com