Integrating OceanBase Monitoring with Prometheus/Grafana
Summary
This article introduces how to integrate OceanBase monitoring with Prometheus and Grafana.
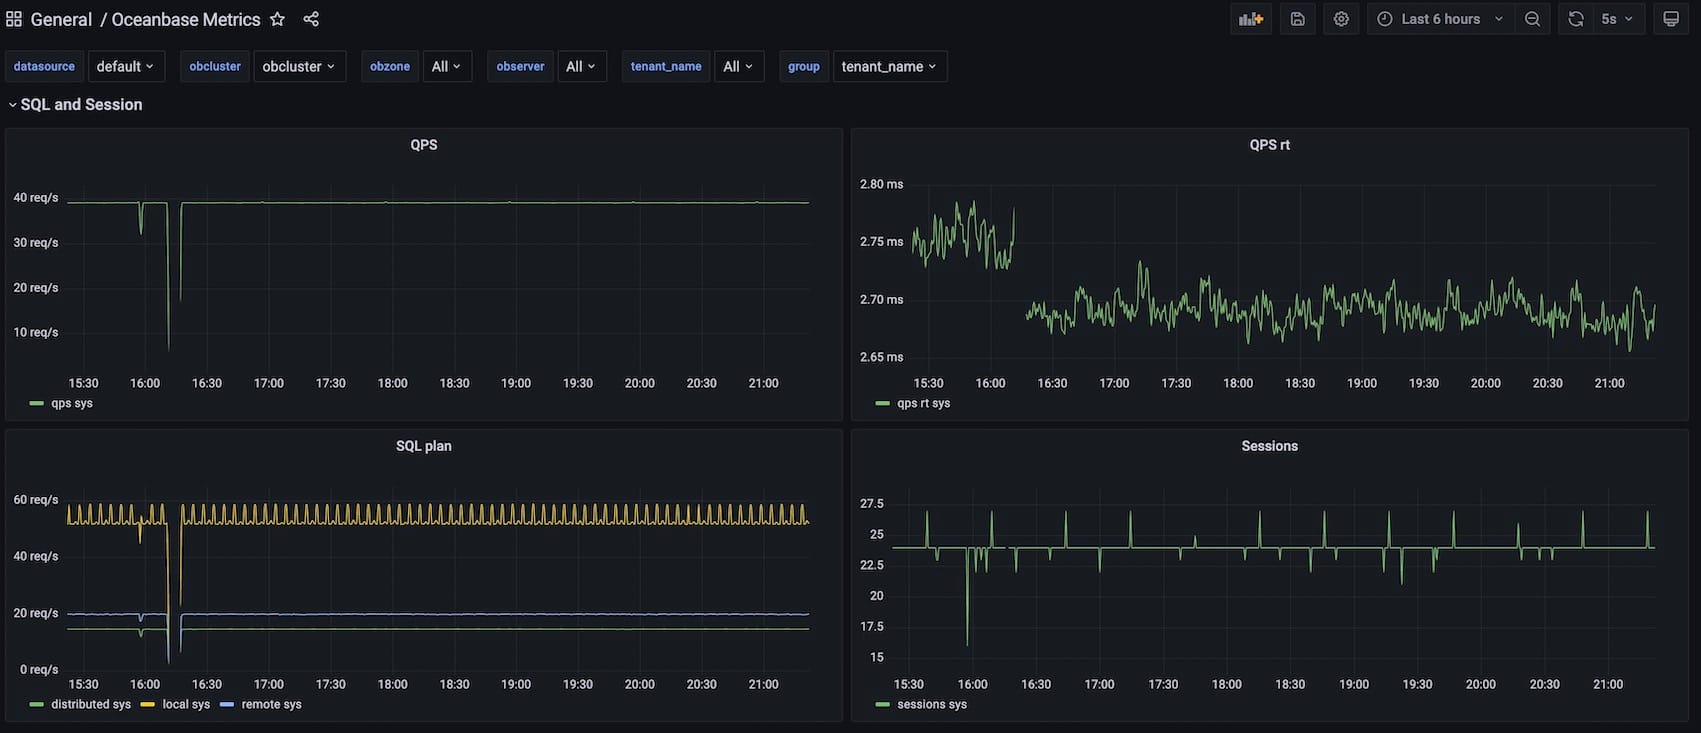
Installation Flow
The general process breaks down into three main steps:
- Install OceanBase and OBAgent
- Install Prometheus and Grafana
- Configure Prometheus and Grafana
Install OceanBase and OBAgent
For how to install OceanBase, refer to the previous article OceanBase Offline Installation. This section focuses on how to install OBAgent; you can also refer to the document Use OBD to Deploy OBAgent.
OBAgent is a monitoring data collection framework. OBAgent supports both push and pull data collection modes, which can satisfy different application scenarios. The plugins OBAgent supports by default include host data collection, collection of OceanBase database metrics, monitoring data label processing, and an HTTP service for the Prometheus protocol. To make OBAgent support collection from other data sources or customize the data processing flow, you only need to develop the corresponding plugin.
For the OBAgent configuration, the OBAgent settings are added on top of the original configuration. For details, refer to distributed-with-obproxy-and-obagent-example:
1 | obagent: |
A few special notes:
- The name “oceanbase-ce” under depends must match the cluster name in the configuration file.
- The configuration under servers must be exactly the same as the servers configuration in the “oceanbase-ce” section of the configuration file.
- Remember home_path; you’ll need this path later.
After the installation is complete, you can run “obd cluster display” and see that OBAgent has already started.
1 | obd cluster display obtest |
Install Prometheus and Grafana
Pick a machine to install Prometheus and Grafana. Try not to use one of the OBServer machines. In this example, Prometheus and Grafana are deployed on the OBProxy machine.
- Download Prometheus and Alertmanager from https://prometheus.io/download/. This chapter will not cover how to use Alertmanager.
- Download Grafana from https://grafana.com/grafana/download?pg=get&plcmt=selfmanaged-box1-cta1
- Copy the Prometheus and Grafana archives to the OBProxy machine.
- Extract Prometheus and Grafana.
1 | # tar -xzf prometheus-2.31.0.linux-amd64.tar.gz |
Configure Prometheus and Grafana
Configure Prometheus
- Copy the Prometheus configuration file from the OBAgent machine into the Prometheus installation directory.
1 | # cd prometheus-2.31.0.linux-amd64 |
Notes:
- observer001 is one of the machines where OBAgent is installed.
- /root/observer is the home_path configured earlier for OBAgent in the configuration file.
- A few files are copied over from observer001: prometheus.yaml and rules. rules stores the scrape rules, and prometheus is the file that configures Prometheus.
Start Prometheus:
1 | nohup ./prometheus --config.file=./prometheus.yaml >> run.log 2>&1 & |
Check run.log to view the runtime logs. Under normal conditions,
1 | # curl http://localhost:9090/metrics |
returns a large amount of data.
Configure Grafana
1 | # cd grafana-8.2.3/ |
You can use either run.log or ps -ef|grep grafana to confirm that Grafana is working properly.
Open the Grafana page. On first login, enter admin/admin, then set the administrator password, and then add a data source.
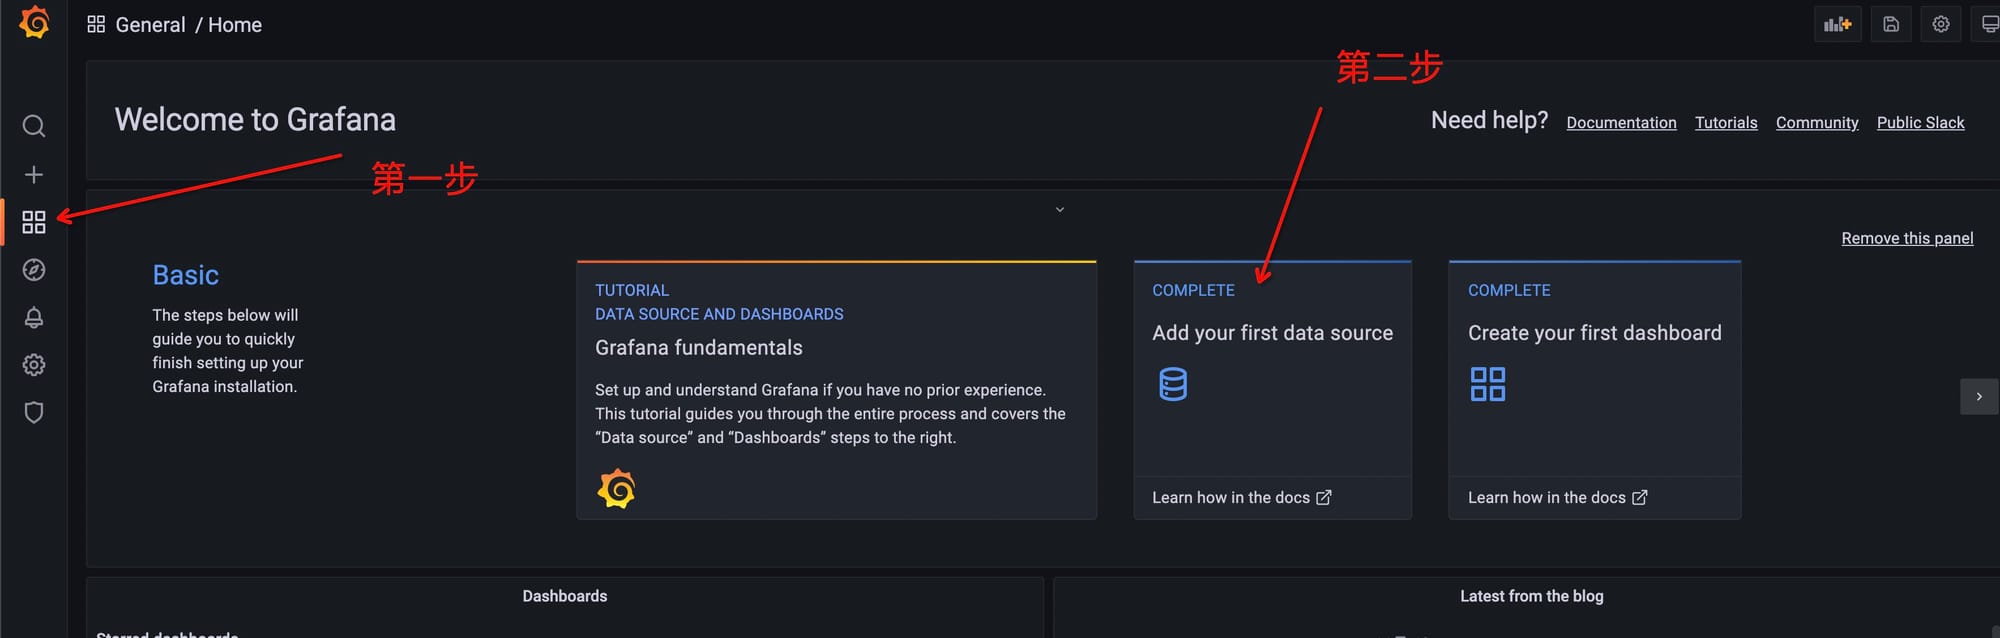
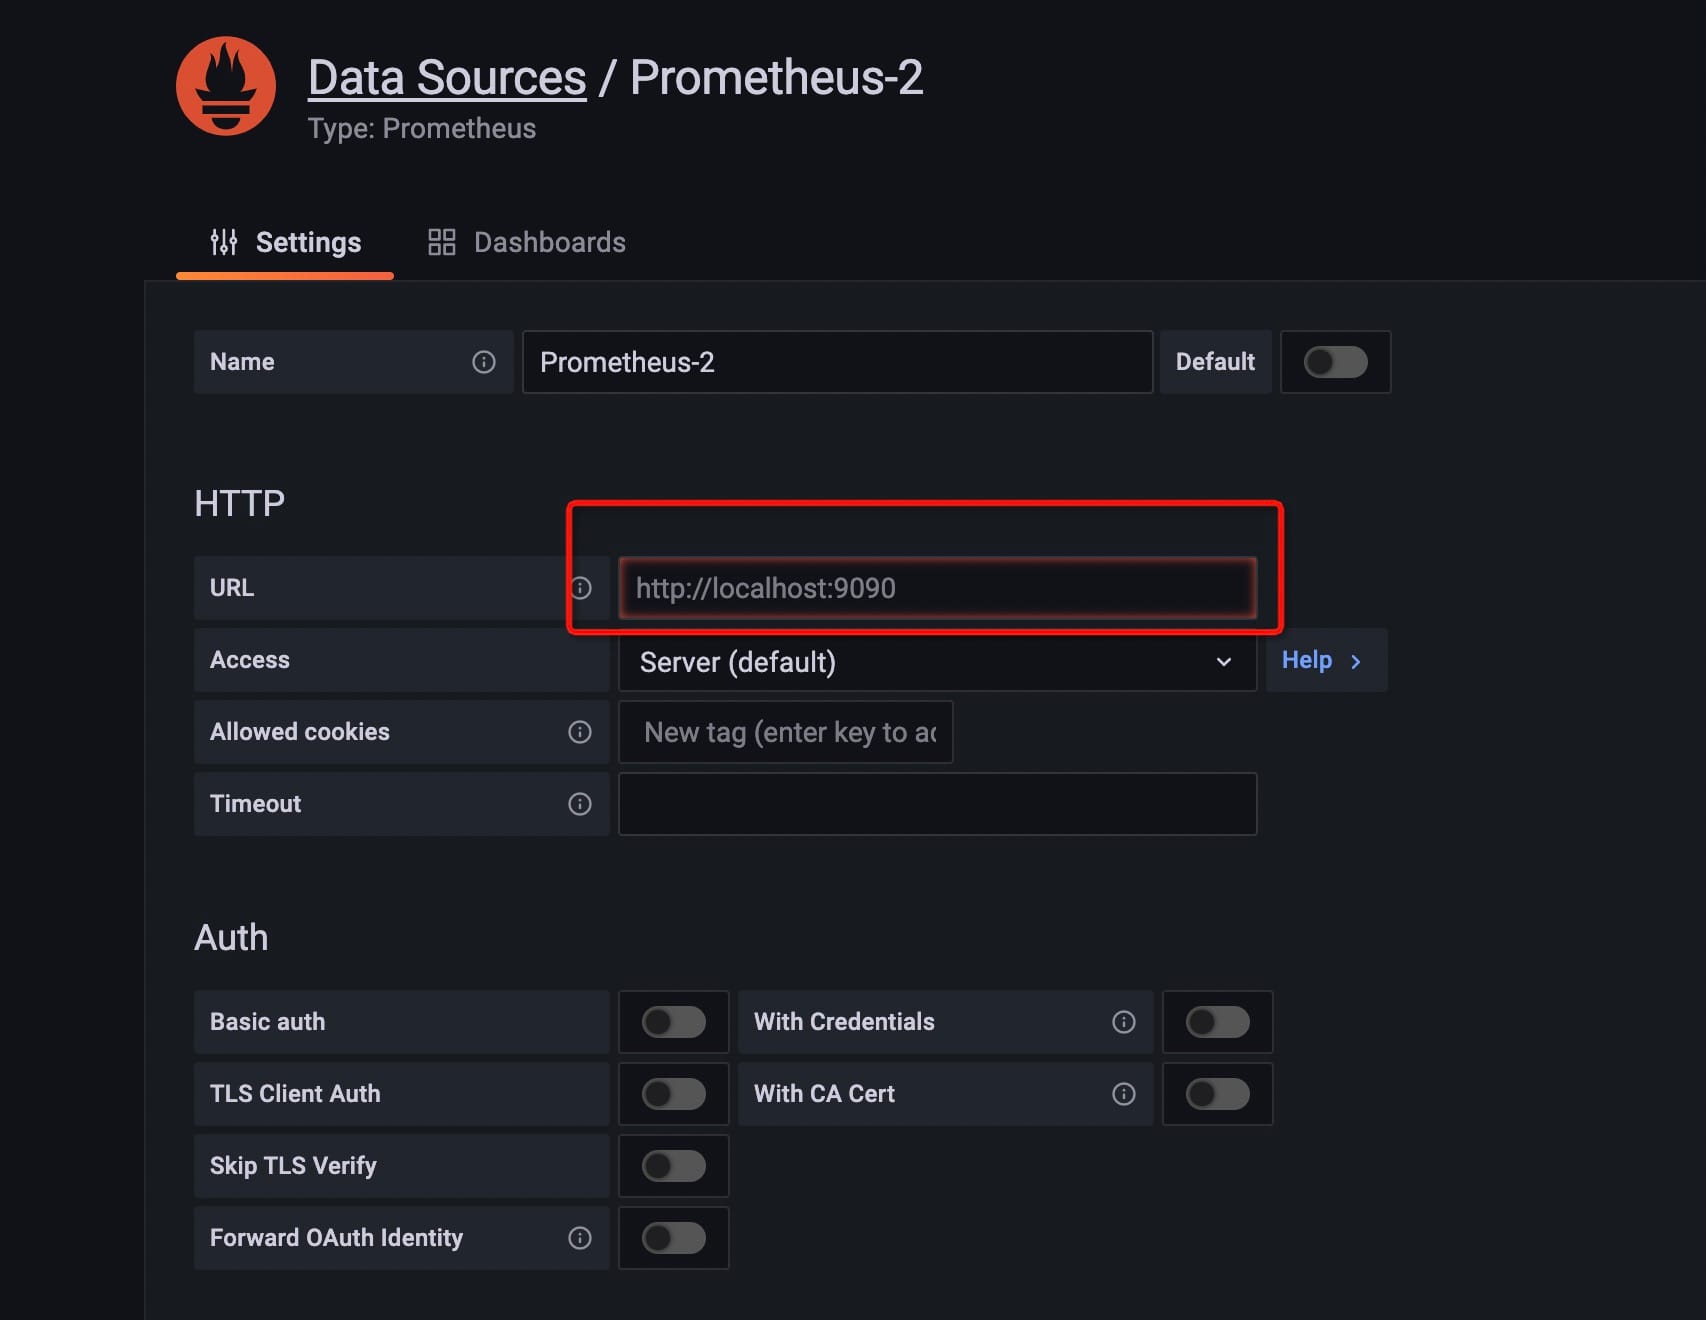
After going into Add data source, select Prometheus, then configure Prometheus, with the key setting being the URL.
Import the configuration items.
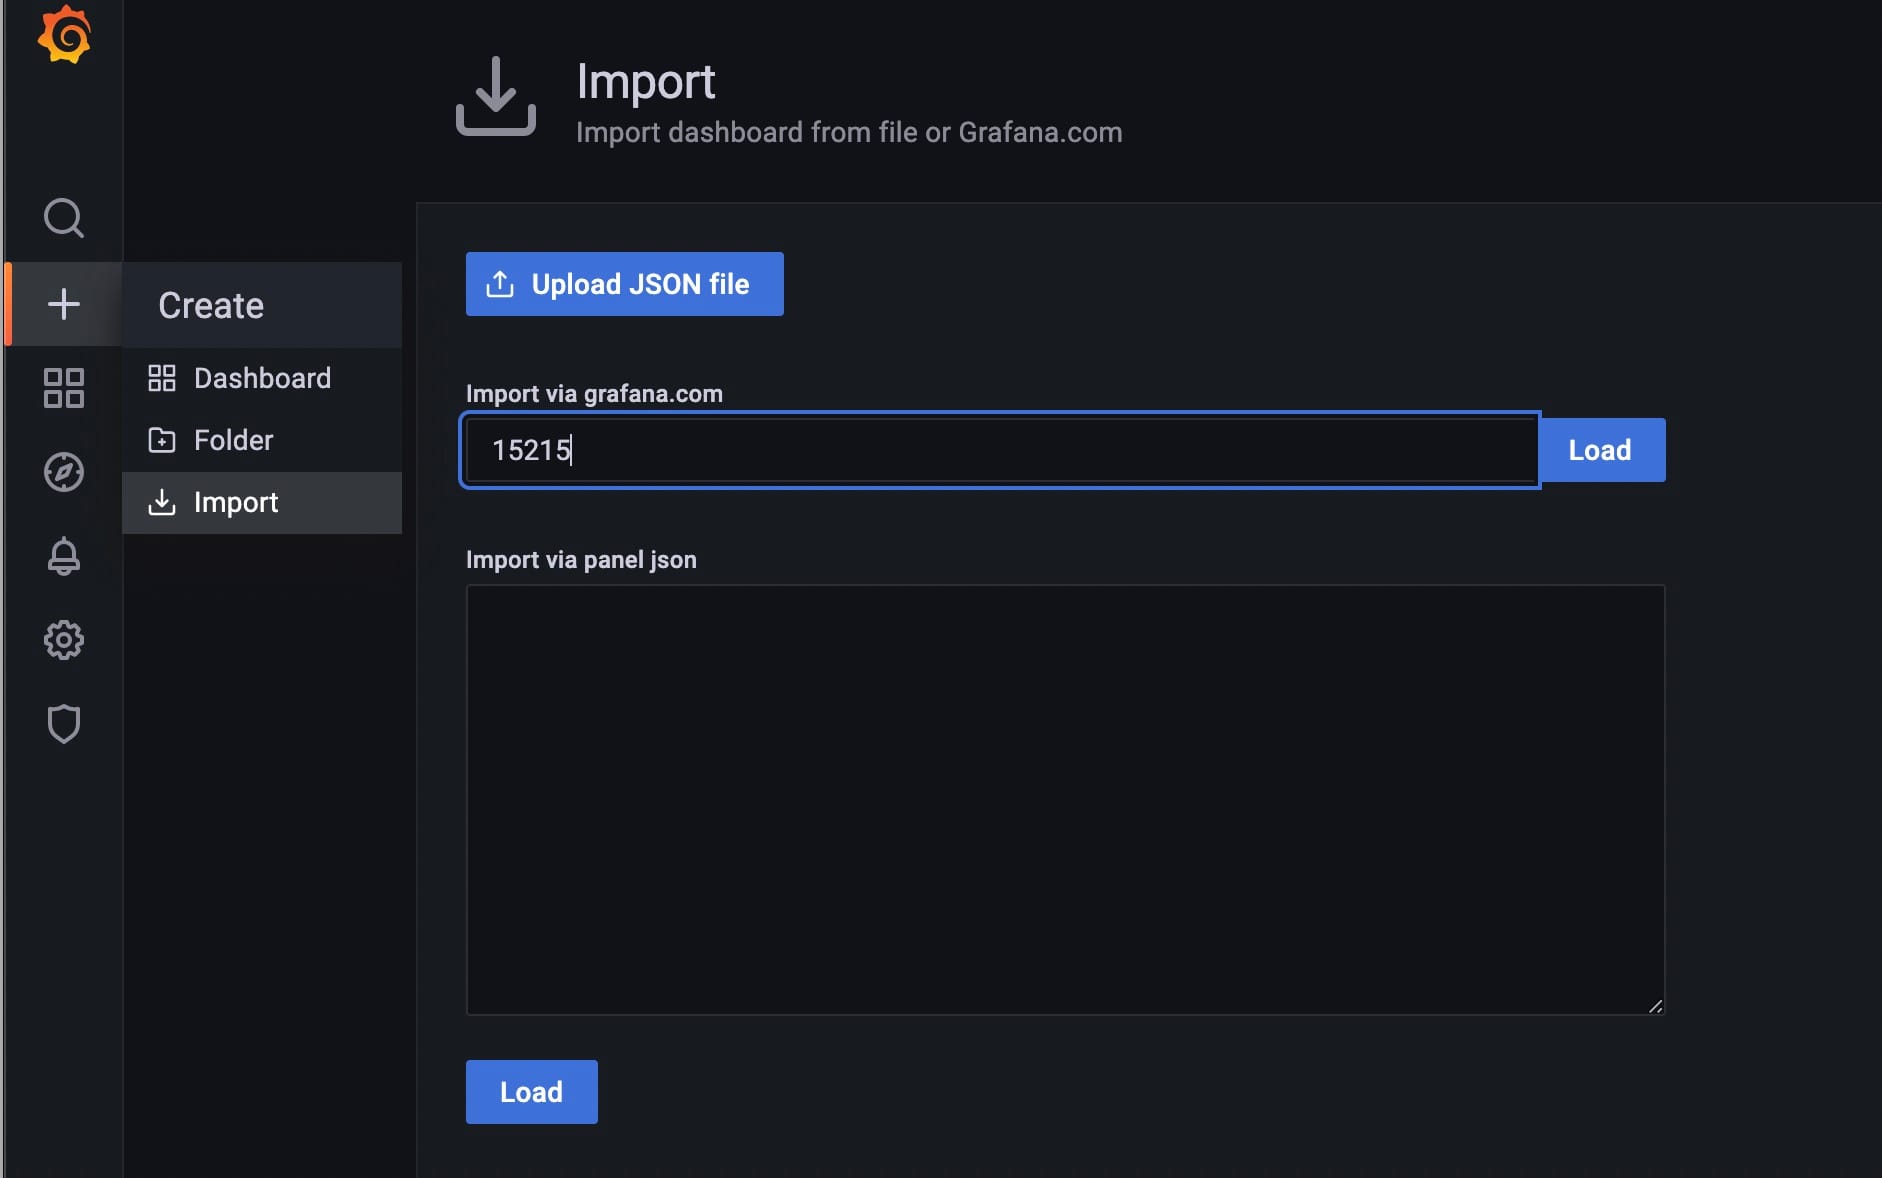
OceanBase has prepared 15215 and 15216 in advance: one for monitoring OceanBase, and one for monitoring the host.
After loading the templates, you’ll see the two preset dashboards in the dashboard list.
Congratulations, you have finished integrating OceanBase monitoring with Prometheus and Grafana.