Getting to Know ASH — Opening the Database's "Treasure Box of Time"
1. Starting From Supermarket Surveillance: The Database’s “Time Travel”
Picture this scene: as a supermarket manager, when customers complain about long checkout lines, what do you do?
- Replay the surveillance footage → pinpoint the peak-traffic period
- Watch the checkout-counter status → spot a malfunctioning scanner
- Track a specific customer → analyze why they got held up
ASH (Active Session History) is precisely the database world’s “intelligent monitoring system.” Like a tireless recorder, it takes a work snapshot of the database every second, helping you:
- 🕒 Reconstruct the database’s state at any moment
- 🔍 Catch the “culprit” slowing down the system
- 📊 Quantify the resource consumption of every operation
This magical “treasure box of time” lives in OceanBase’s v$ob_active_session_history view, waiting for you to explore.

2. A Five-Minute Experience: Opening the Database’s “Treasure Box of Time”
We’ve prepared three zero-prerequisite experiments to let you quickly feel the charm of ASH.
Experiment 1: Look at the Database Right Now
Let’s see what the database has been busy with in the last 10 seconds:
1 | -- Check what the system has been doing in the last 10 seconds |
What you might see:
1 | +----------------------------+------------+----------+------------------------+ |
We can see:
- Session 3221931170 is waiting for px execution to finish (px loop condition wait)
- Session 3221923627 is waiting for a read I/O to complete (db file data read)
- Session 3221927472 was working at 20:16:12, and 2 seconds later it’s waiting for an rpc result to return (sync rpc)
Experiment 2: Find the Busiest “Employees”
Find the busiest sessions in the last 10 minutes:
1 | -- Count the most active sessions in the last 10 minutes |
Typical output:
1 | +------------+-----------------+ |
We can see that session 3221977564 was active for 283 seconds over the past 10 minutes. If there were only these three sessions in that period, then session 3221977564 produced 283 / (283 + 142 + 77) = 56% of the database’s load.
Experiment 3: Travel Back in Time
Look at the busiest SQL over a past time window.
1 | -- Query the sql_id with the highest execution load over a past time window |
1 | +----------------------------------+-----------------+ |
3. Unlocking the Box’s Secrets: How ASH Works
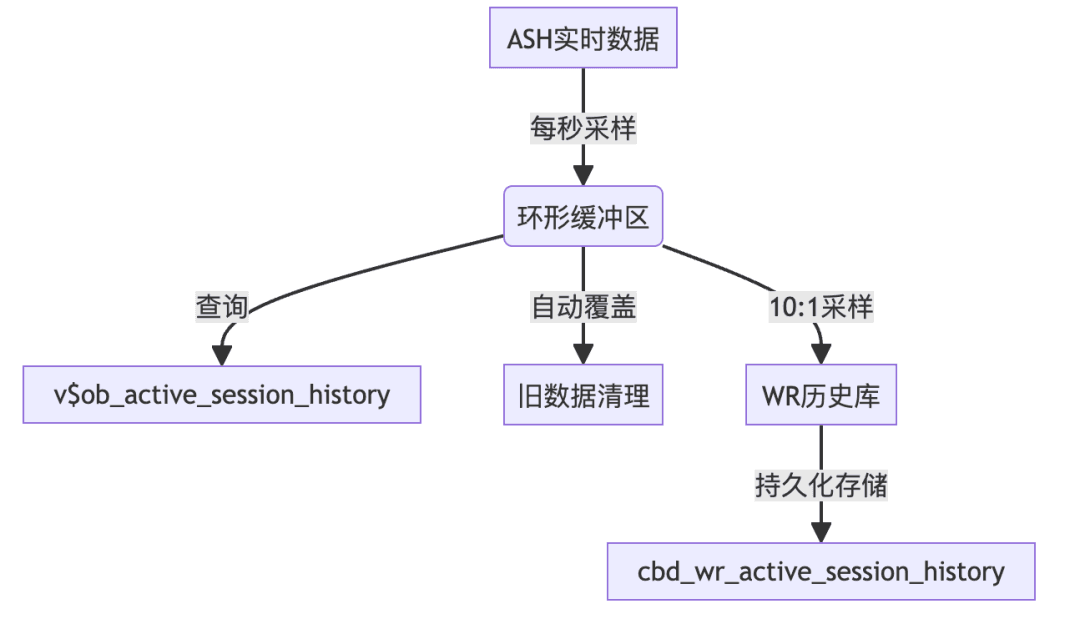
ASH is like the database’s automatic recorder, taking a state snapshot every second of all sessions that are working (for example, sessions executing SQL). These snapshots are all stored in the v$ob_active_session_history system view.
The implementation works as follows.
1. The Principle of Selective Recording
- Record all tasks executing in the database, assigning each a unique identifier, session_id, including:
- A user client connecting to the database to execute a SQL request.
- Internal rpc execution.
- Background threads executing tasks, such as the dump thread, clog thread, timer thread, and so on.
- Record only the state of active sessions; idle sessions are not recorded, including:
- A session executing SQL is considered active. If a session is in the sleep state, not handling a SQL request, it’s treated as idle and won’t be recorded.
- If a background thread isn’t executing a task, or is waiting for a new task to be scheduled, it’s treated as idle and won’t be recorded.
- For a session waiting on a resource (such as a lock or disk I/O), ASH marks its wait event (e.g.
db file data read).
2. The Time-Slicing Mechanism
Inside each observer there is a dedicated ASH thread that, on a 1-second cycle, visits all active sessions in the database and records their state, where:
- Each row in gv$ob_active_session_history represents the state of one active session at a given moment.
- If a session’s working time is very short (say, under 1 second) — like someone who blinks just as the photo is taken — ASH may fail to capture it. For such cases, we recommend repeating the workload and widening the query time range, so ASH’s statistics are more reliable.
3. The Ring-Buffer Design
ASH snapshot data is kept in a 30 MB circular buffer. Once the stored data exceeds 30 MB, the oldest data is overwritten automatically. Starting from version 4.2.5.3, we implemented the ability to automatically archive ASH data as WR before it’s overwritten. But in earlier versions, ASH historical data could still be lost. When we want to preserve the latest ASH records, we can manually trigger a WR snapshot:
1 | -- Manually trigger a WR snapshot |
After running this command, the ASH snapshot data not yet persisted to WR at the current moment is persisted at a 10:1 ratio.
4. Frequently Asked Questions (FAQ)
Q1: After running the example SQL, I got no data back. Why?
There may be two reasons:
- The database really was idle during the query (no active sessions).
- The time range was set incorrectly (the chosen window’s ASH data has already been overwritten).
Q2: What if ASH’s historical data has been overwritten?
OceanBase automatically compresses and saves ASH data to the WR history store; just query the dba_wr_active_session_history view (for the sys tenant, query the cdb_wr_active_session_history view). Although some details are trimmed, the key information is preserved.
For more on WR, see the OceanBase official documentation — WR Overview[1].
Q3: Does enabling ASH affect database performance?
ASH is always on in the OceanBase database, with negligible impact on performance (typically under 1% CPU consumption). ASH constantly occupies 30 MB of memory per observer process.
5. Coming Up Next
In the second installment, we’ll become “database detectives” and use the ASH four-dimensional analysis method to crack these mysteries:
- Why does the system slow down every afternoon?
- What’s the real reason a certain SQL suddenly got slow?
- How do you quickly find the “chief culprit” SQL dragging down the system?
6. References
[1] OceanBase official documentation — WR Overview: https://www.oceanbase.com/docs/common-oceanbase-database-cn-1000000003381313
Finally, I’d like to recommend the WeChat official account “Lao Ji’s Tech Talk” run by Lao Ji, the head of OceanBase Open Source. It continuously publishes all kinds of technical content related to #Databases, #AI, and #Tech Architecture. If you’re interested, feel free to follow!
“Lao Ji’s Tech Talk” hopes not only to keep bringing you valuable technical content, but also to contribute to the open source community together with everyone. If you appreciate the OceanBase open source community, light up a little star ✨! Every Star you give is fuel for our efforts.