OceanBase Developer Handbook, Part 5: How to Debug OceanBase
Abstract
The OceanBase Developer Handbook mainly guides developers on how to participate in OceanBase development, clearing obstacles you may encounter while preparing to contribute. This section covers the following articles, with more to be added in the future. For now, the OceanBase source code references the Open-Source Database OceanBase Source Code Walkthrough series on the OceanBase open-source official site:
- How to compile the OceanBase source code
- How to set up an IDE development environment
- How to become an OceanBase Contributor
- How to edit the OceanBase documentation
- How to debug OceanBase
- How to run tests
- How to fix bugs
This article introduces how to debug OceanBase. We recommend several approaches:
- Remotely debug OceanBase with VS Code
- Debug OceanBase locally with gdb
- Debug OceanBase locally with CLion in a Linux environment
Steps
Preparation
One important step in debugging OceanBase is obtaining OceanBase’s startup parameters. Each machine has its own hardware configuration, which leads to different startup parameters. The approach, however, is basically the same.
- Install and deploy an environment using OBD (https://github.com/oceanbase/obdeploy).
1 | 1. For a standalone deployment in a networked environment, refer to the document https://open.oceanbase.com/quickStart |
- After successfully deploying the environment, compile the debug build of OceanBase. Refer to the earlier document How to Compile the OceanBase Source Code.
- Capture OceanBase’s startup parameters (via ‘ps -ef|grep observer’).
- (Optional) In a distributed environment, replace the observer installed and deployed by OBD with your compiled observer binary.
In my standalone test environment, after installing and deploying OceanBase with OBD, my OceanBase startup parameters are as follows:
1 | observer -r xxx.xxx.xxx.xxx:2882:2881 -o __min_full_resource_pool_memory=268435456,enable_syslog_recycle=True,enable_syslog_wf=True,max_syslog_file_count=4,memory_limit=69G,system_memory=27G,cpu_count=19,datafile_size=1029G,clog_disk_utilization_threshold=95,clog_disk_usage_limit_percentage=98 -z zone1 -p 2881 -P 2882 -n obcluster -c 1 -d /home/xxxxxxx/observer/store -i em1 -l INFO |
Debugging With VS Code
- Set up the remote connection environment.
1 | 1.1 Establish trusted login from the development machine to the test machine. Refer to the document https://open.oceanbase.com/docs/community/oceanbase-database/V3.1.1/optional-set-password-free-ssh-logon |
- Connect to the remote machine over remote SSH.
1 | Ctrl + p |
Open the corresponding source code directory.
Refer to the earlier article How to Compile the OceanBase Source Code.
Set the debug startup parameters via the menu “Run” –> “Add Configuration”. If you’ve set them up before, modify the startup parameters via the menu “Run” –> “Open Configurations”.
My configuration is as follows:
1 | { |
Note: the arg parameters here come from the startup parameters obtained during the preparation in step one. Each machine has its own configuration. My parameters are as follows, where:
1 | 1. ${OB_SRC_DIR} is the source code directory, and ${IP} is the observer's bound IP. |
- Start debugging by clicking the menu “Run” –> “Start Debugging”.
Debugging Locally With gdb Directly
Log in to the remote machine and enter the ${OB_SRC_DIR} source code directory.
Refer to the earlier article How to Compile the OceanBase Source Code.
Edit .gdbinit in your home directory and add the following line, replacing ${OB_SRC_DIR} with the root directory of the OB source code:
1 | add-auto-load-safe-path ${OB_SRC_DIR}/.gdbinit |
- vi ${OB_SRC_DIR}/.gdbinit
1 | file build_debug/src/observer/observer |
Note: the args parameters here come from the startup parameters obtained during the preparation in step one. Each machine has its own configuration. My parameters are as follows, where:
1 | 1. ${OB_SRC_DIR} is the source code directory, and ${IP} is the observer's bound IP. |
- We recommend using TUI. TUI is gdb’s built-in graphical interface, which is fairly intuitive. Here’s a quick note on how to switch to it and the common commands.
1 | 1. gdb -tui + (executable program) enters the tui graphical interface directly. |
- In the source code directory, type gdb to start the gdb debug session.
1 | gdb |
Debugging Locally With CLion
CLion makes reading source code very convenient: symbol navigation works smoothly, and it natively supports code formatting via clang-format. However, I haven’t tried CLion remote debugging—only local CLion debugging. That said, if you want to debug OceanBase locally with CLion, your development machine must run Linux.
CLion is the most comfortable way to debug, but also the most complex, with very demanding requirements.
- Refer to the earlier article How to Compile the OceanBase Source Code.
- Configure CLion’s CMake.
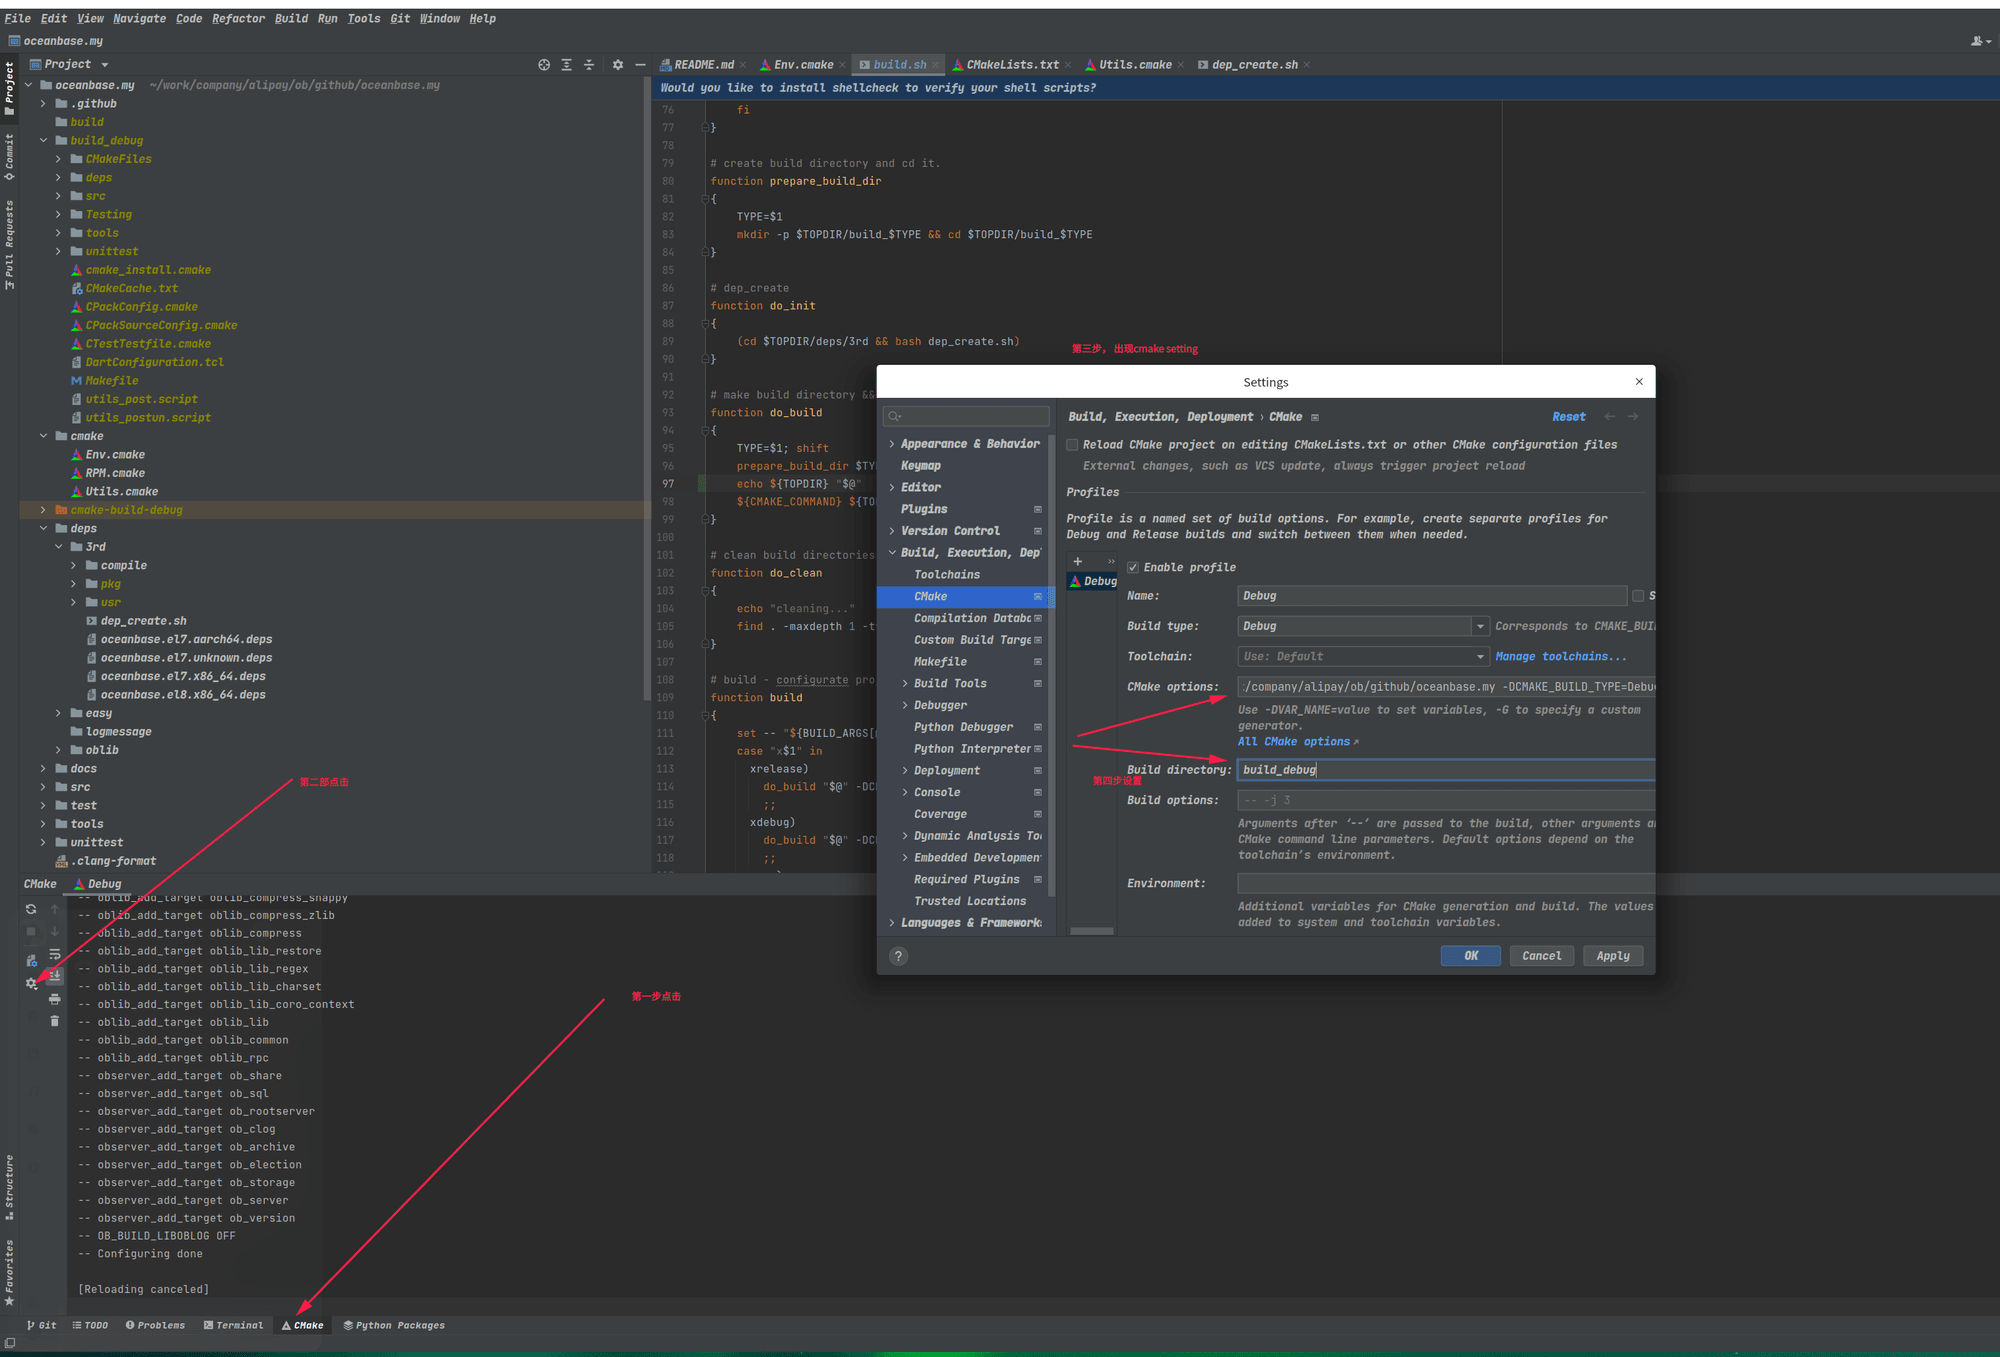
Refer to the image for the detailed steps. Note that:
1 | "Build Directory" needs to be set to "build_debug". |
- Wait a few minutes for CMake generation to finish, then click the menu “Run” –> “Edit Configurations”. You can also, as in the image below, select the build target observer.
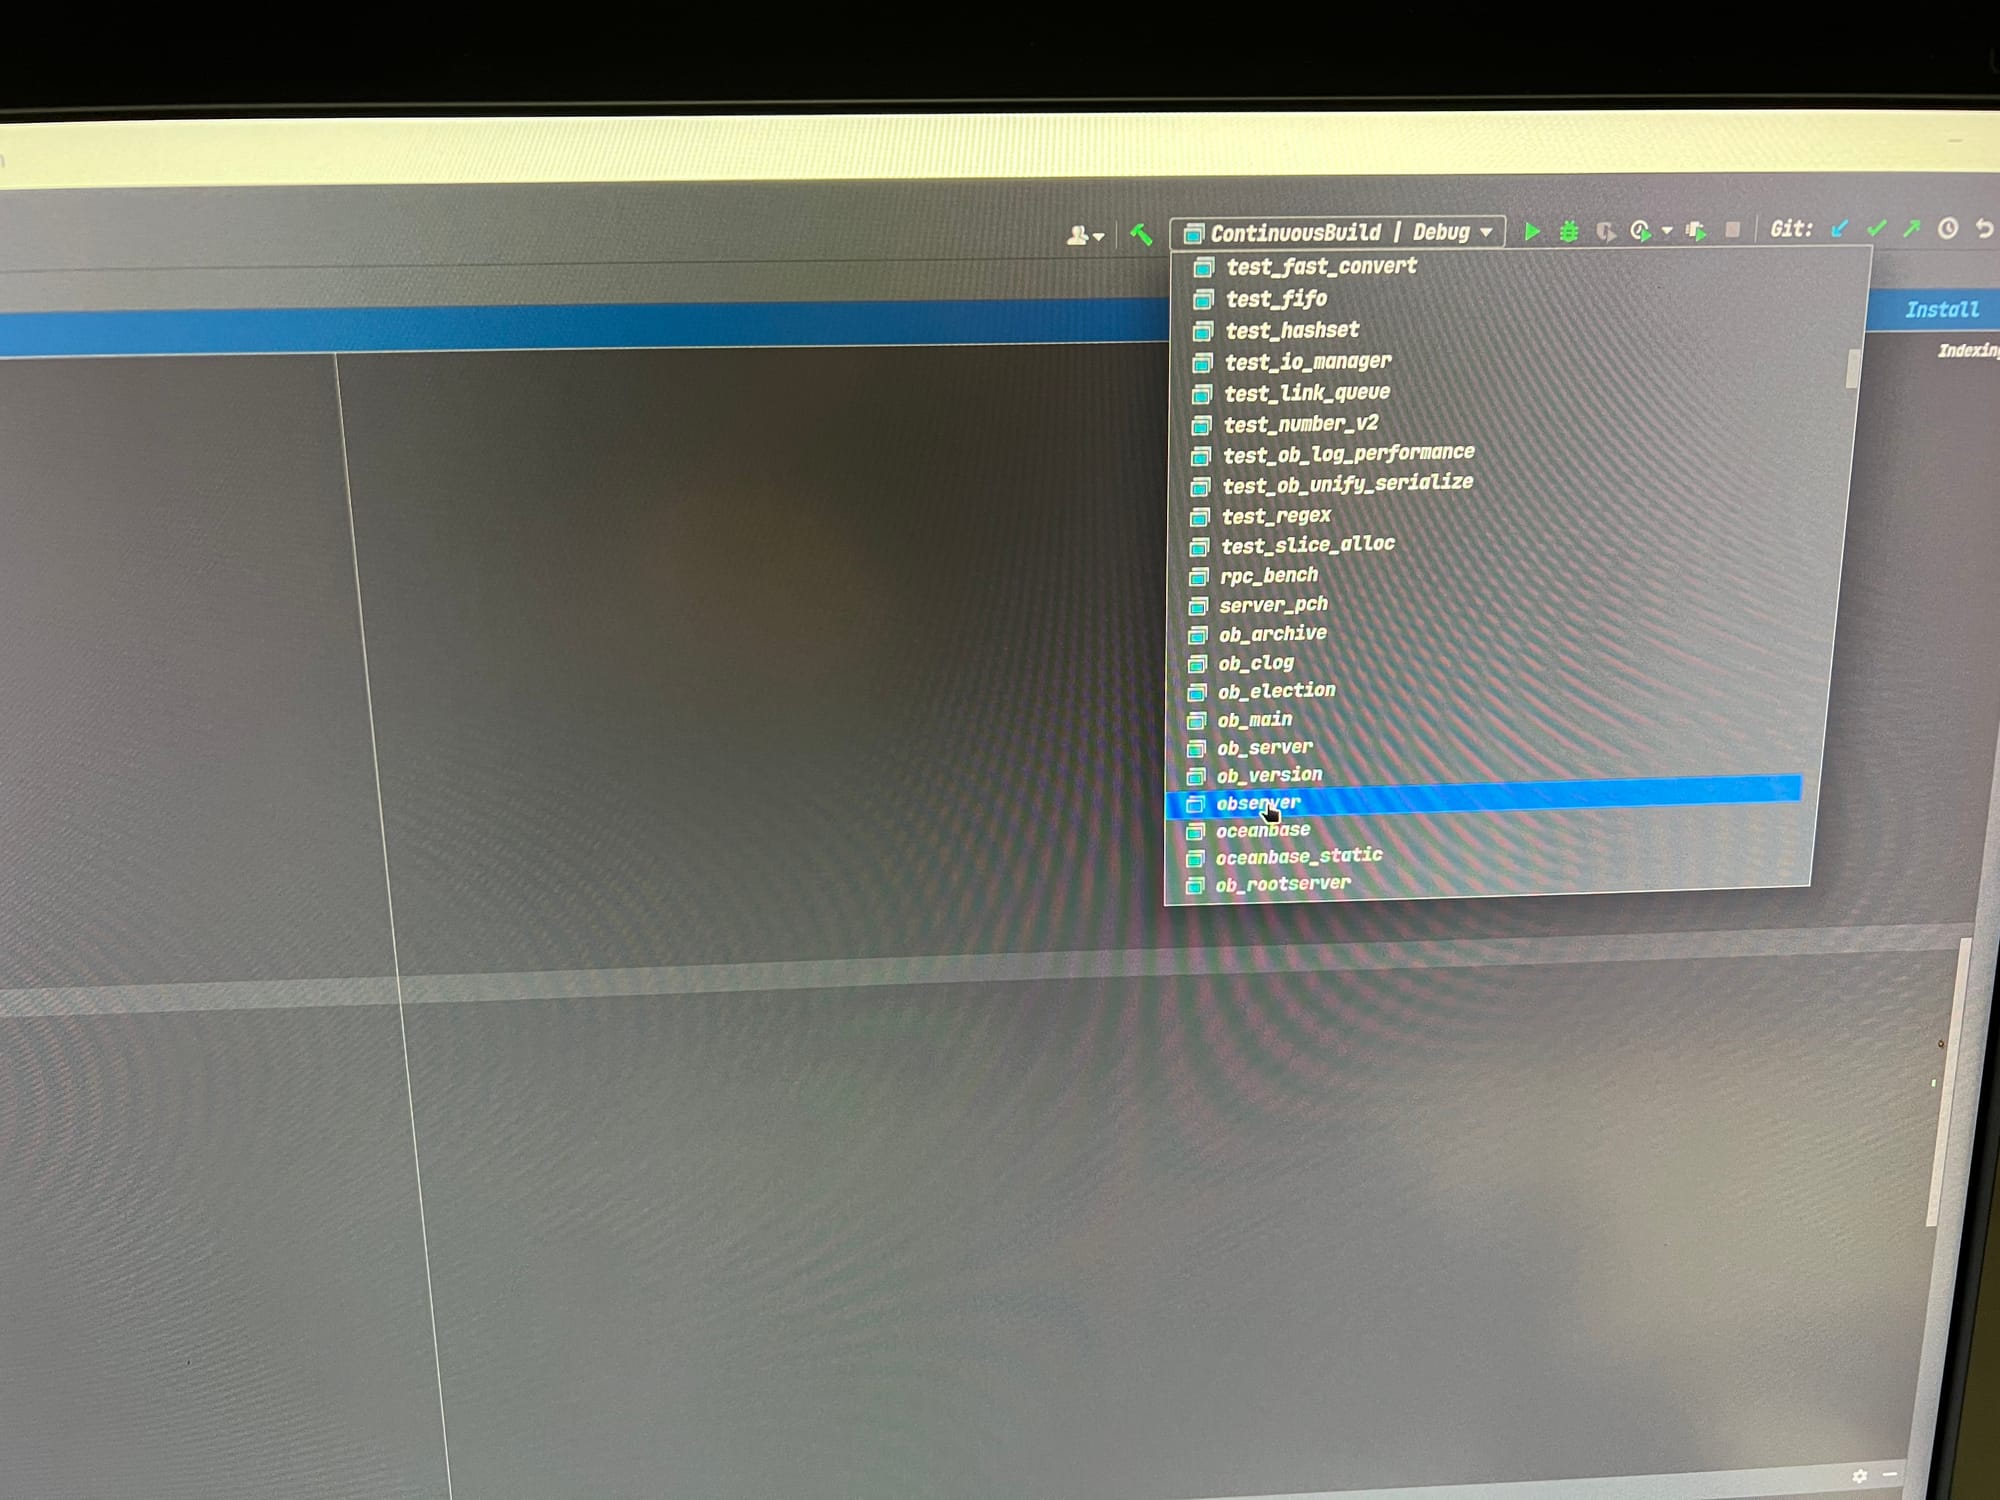
Click the menu “Build” –> “Build observer” to compile observer.
Modify the startup parameters by clicking the menu “Run” –> “Edit Configurations”. After the dialog appears:
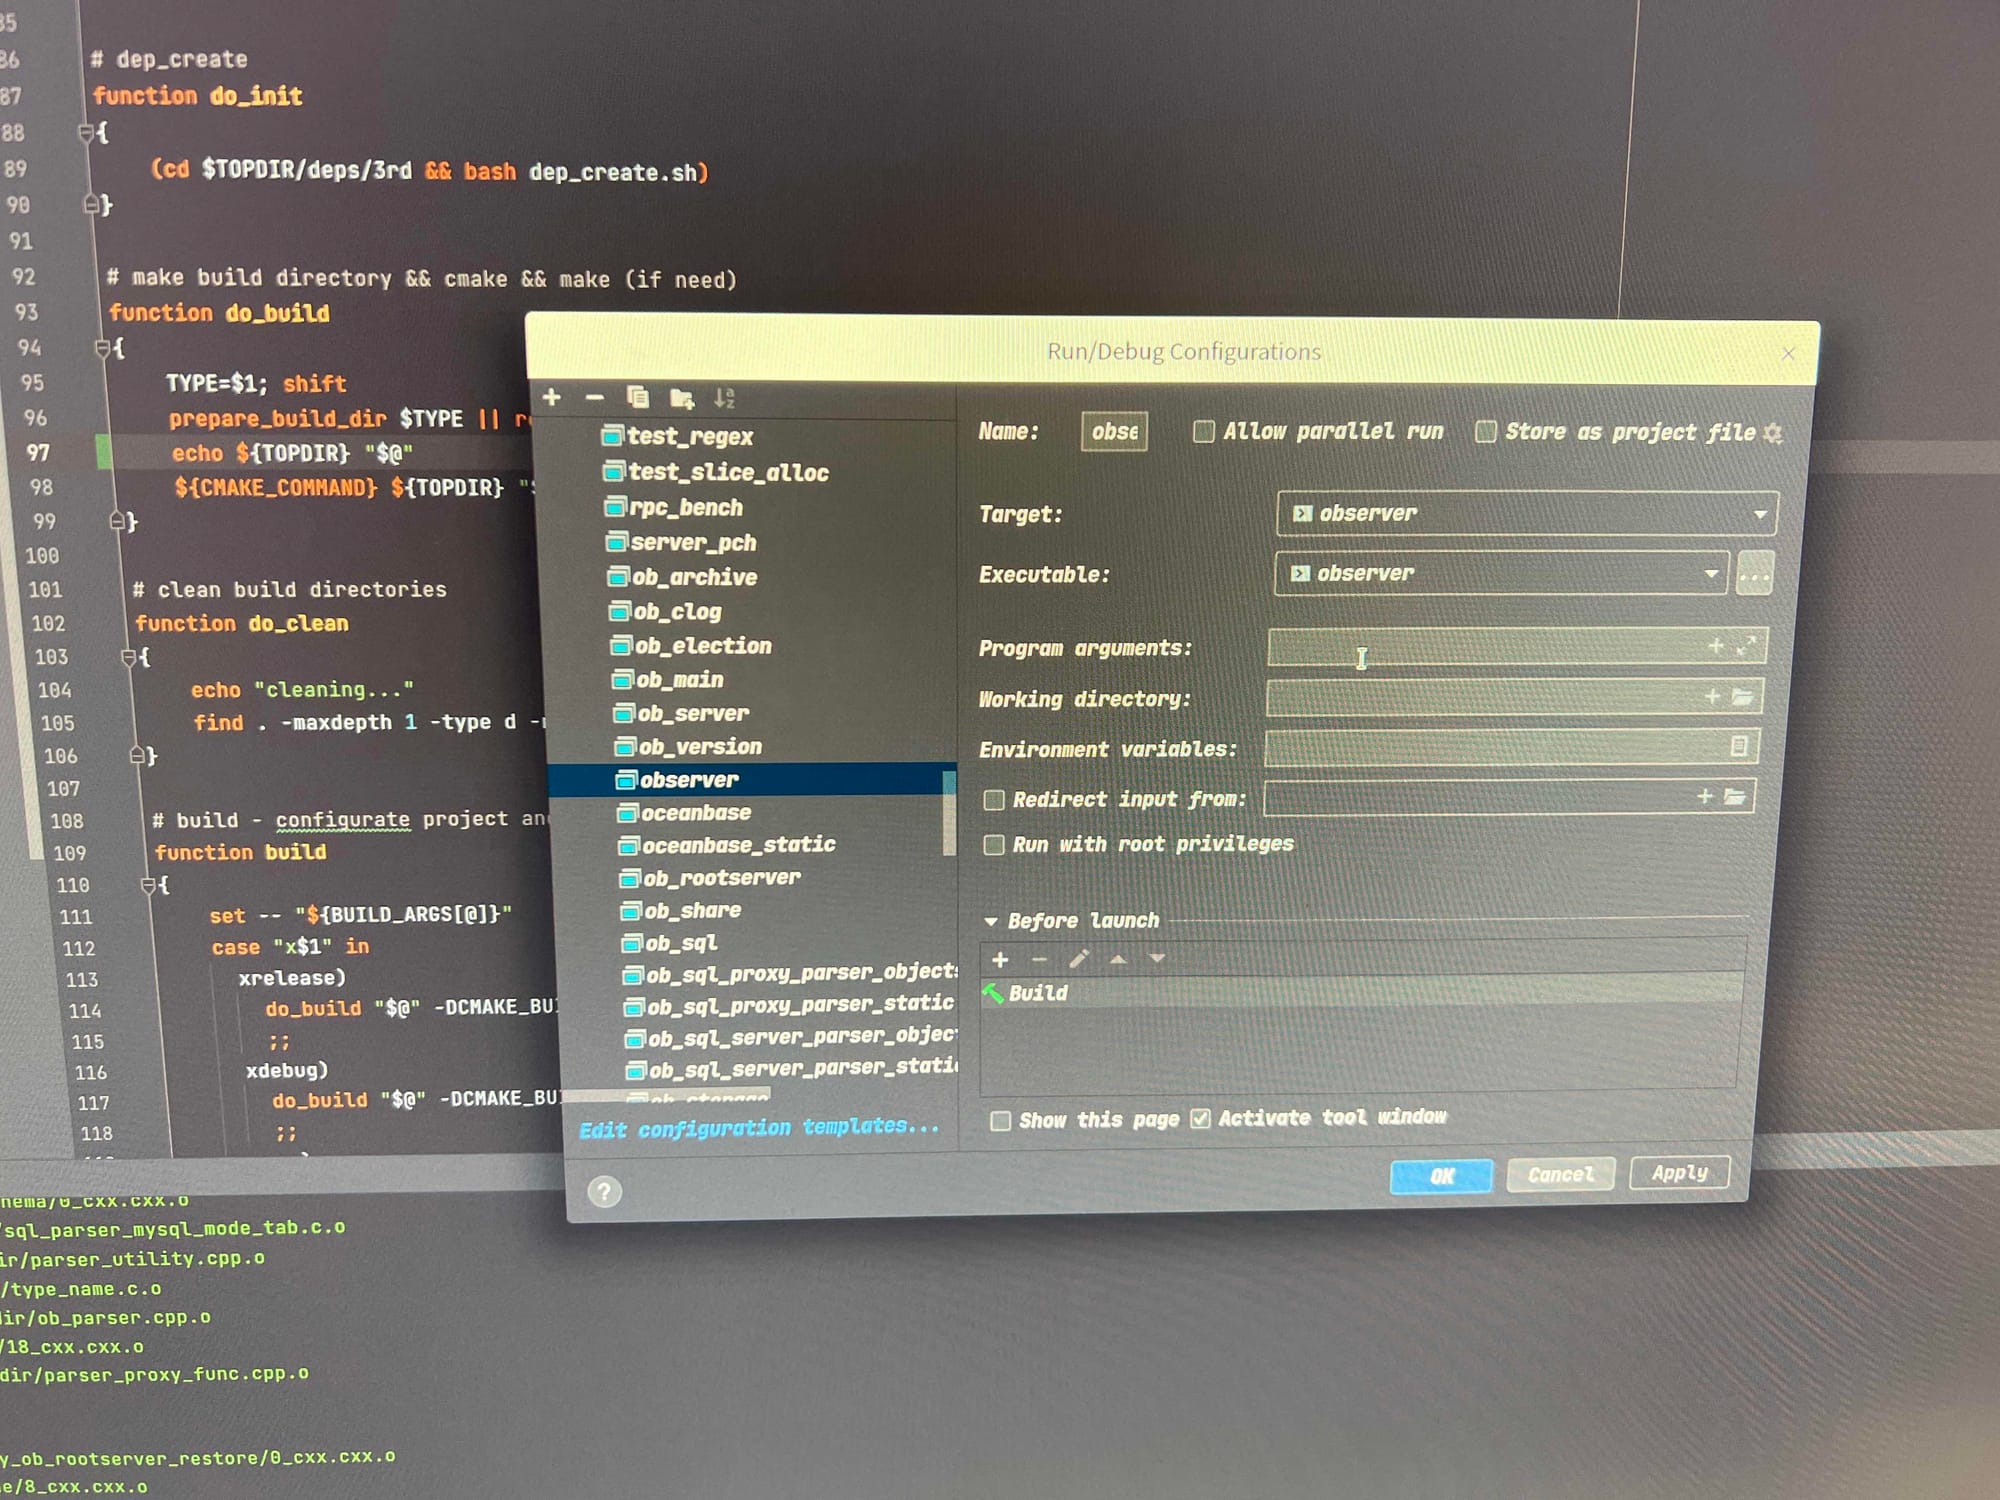
On my machine, “Program Arguments” is:
1 | -r ${ip}:2882:2881 -o __min_full_resource_pool_memory=268435456,enable_syslog_recycle=True,enable_syslog_wf=True, max_syslog_file_count=4,memory_limit=8G,system_memory=4G,cpu_count=16,datafile_size=44G,clog_disk_utilization_threshold=95,clog_disk_usage_limit_percentage=98 -z zone1 -p 2881 -P 2882 -n obcluster -c 1 -d ${data_dir} -i ${devname} -l INFO |
${ip}: the local machine’s IP.
${data_dir}: the data directory.
${devname}: the network interface name corresponding to the IP, usually eth0 or lo.
“Working Directory” must be ${OB_SRC_DIR}.
Open the file src/observer/main.cpp and set a breakpoint at the main function.
Start debugging by clicking the menu “Run” –> “Debug Observer”.