Predicting the 2026 World Cup with seekdb: Data Modeling to Probability Simulation
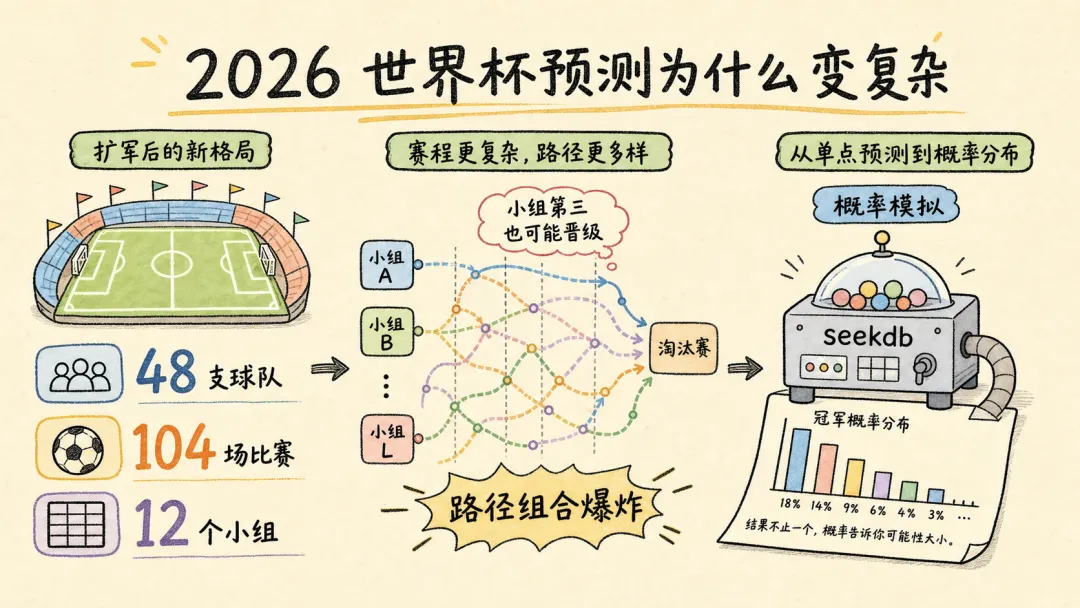
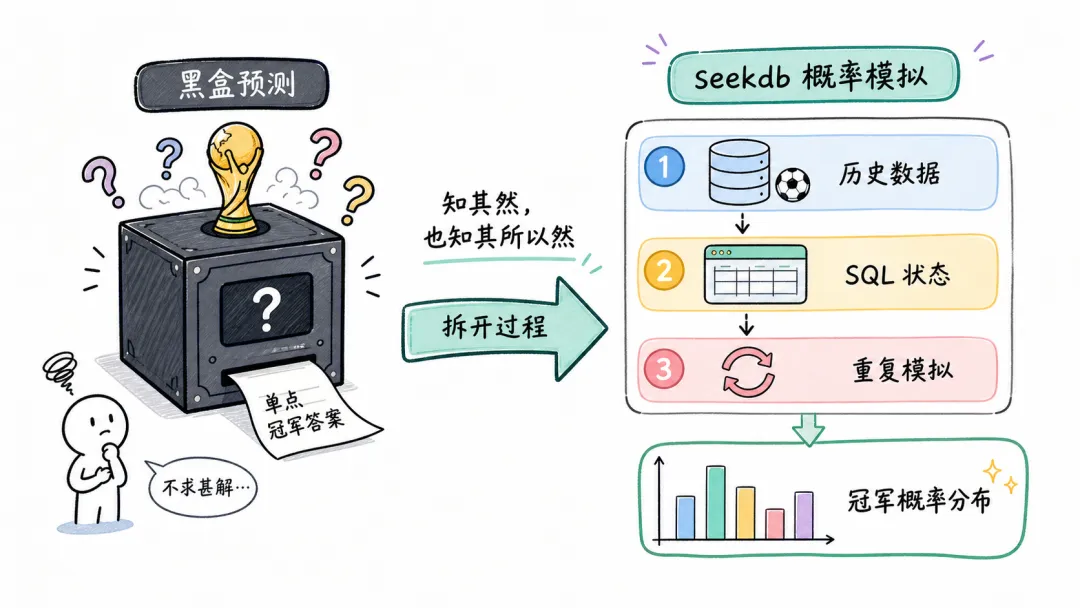
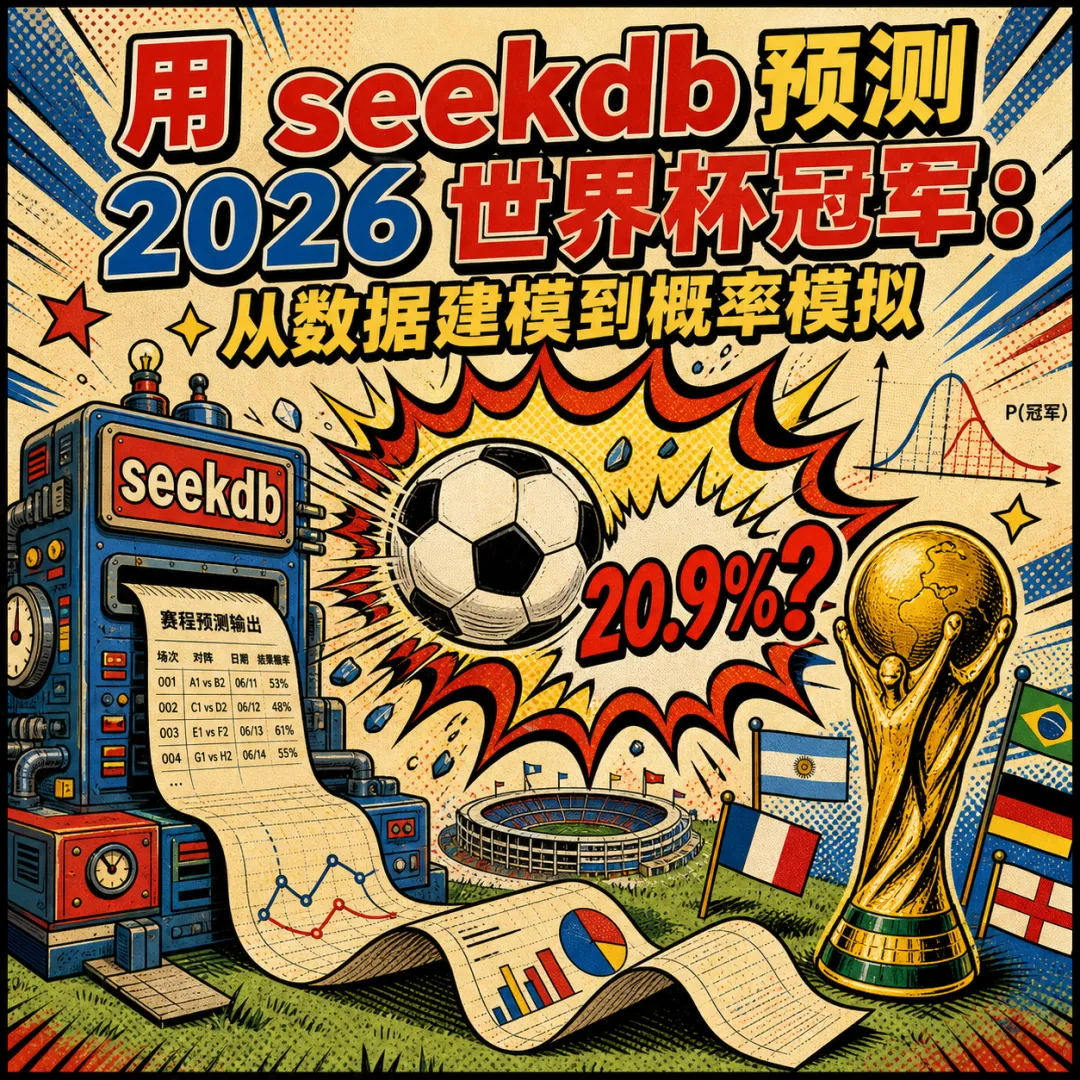
A database can run a complete probabilistic FIFA World Cup simulation. This technical demonstration uses OceanBase seekdb to model the 2026 FIFA World Cup: it imports example historical match data, estimates team strength with Elo ratings, generates group-stage scores with Poisson sampling, advances teams through a simplified knockout bracket in SQL stored procedures, and repeats the tournament to estimate title frequencies.
The output is a technical demonstration, not a forecast or betting recommendation. The sample data, model assumptions, and simplified knockout bracket materially affect the estimates. Because each run samples random outcomes, rankings can shift slightly between runs—especially when the number of simulations is small.
⚽ Want to keep simulation logic close to its data? seekdb is OceanBase’s AI-native database. Explore it at https://github.com/oceanbase/seekdb and see what SQL can model.
seekdb World Cup Monte Carlo simulation model
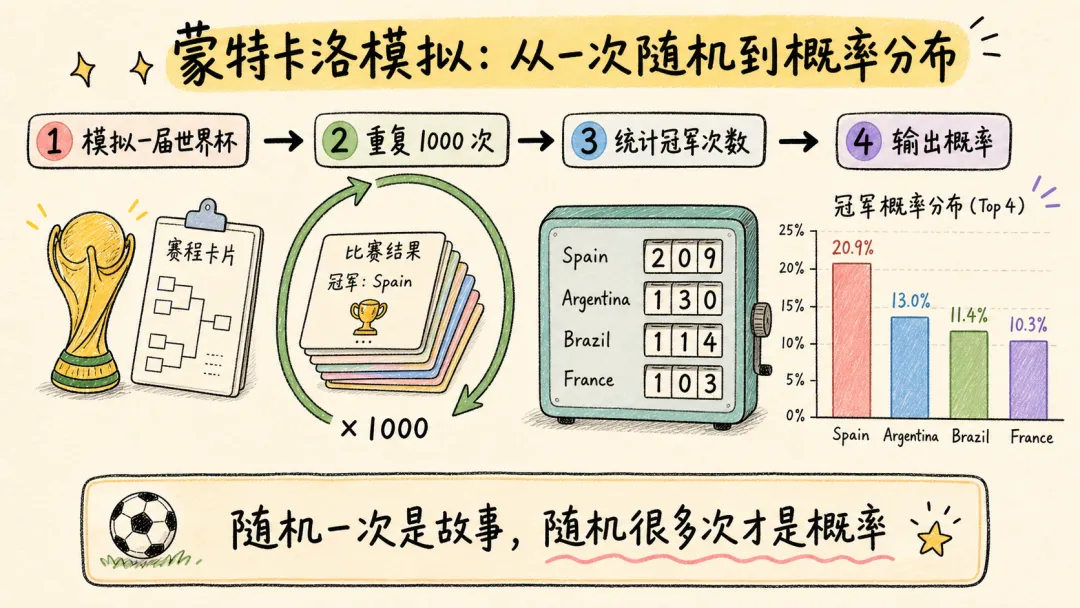
Monte Carlo simulation repeats an experiment with random inputs and summarizes the outcomes. Here, each run plays out one complete tournament. A team’s share of simulated championships is its estimated title frequency under this model—not its real-world probability of winning the World Cup.
The workflow combines three statistical building blocks:
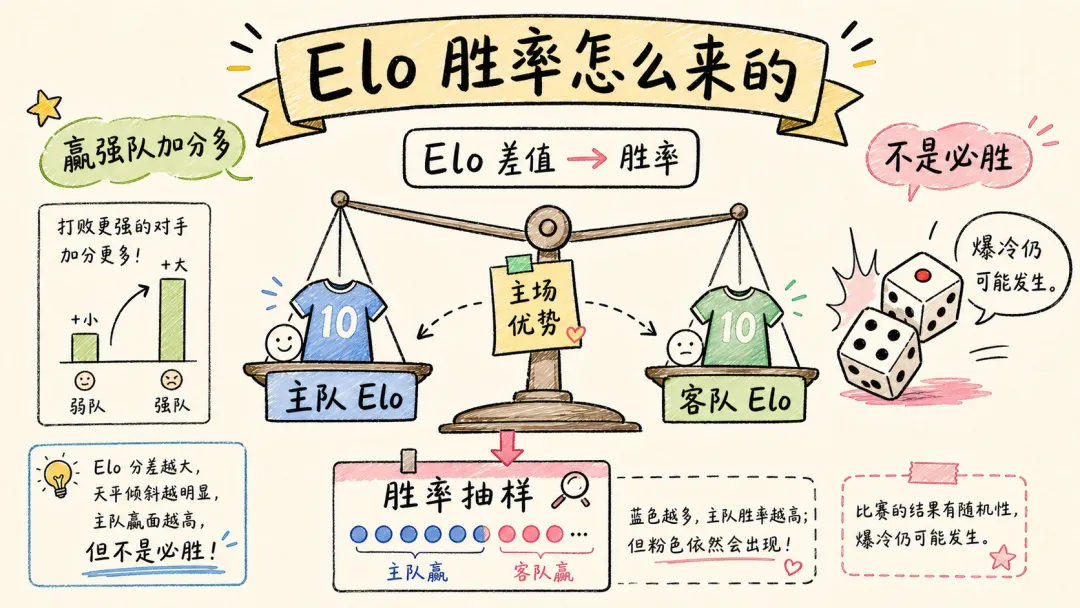
- Elo ratings — assign each team a relative-strength score; the rating gap becomes a knockout-stage win probability.
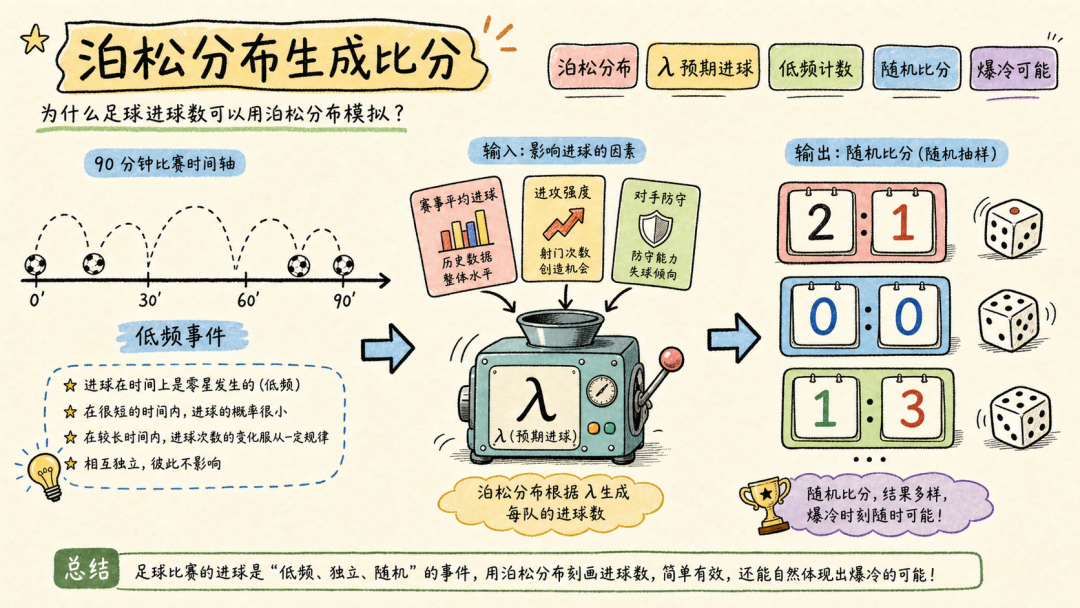
- Poisson distributions — sample group-stage goal counts from each team’s expected scoring rate.
- Monte Carlo aggregation — repeat the tournament in SQL and count each team’s simulated championships.
Core data tables in seekdb
The simulation rests on four tables that stay inside the database:
| Table | Role |
|---|---|
teams |
Team identity, region, and base Elo rating |
matches |
Example international results used to derive strength features |
team_season_stats |
Season-level attacking and defensive features |
worldcup_2026_fixtures |
Simulated group-stage schedule; knockout pairings are generated during each run |
Together, these tables provide the procedure with the teams, group-stage matchups, strength inputs, and score-distribution parameters it needs. The data is illustrative rather than a complete professional forecasting dataset.
Building the seekdb World Cup workflow in SQL
After importing historical data, the project defines SQL stored procedures that execute one complete tournament:
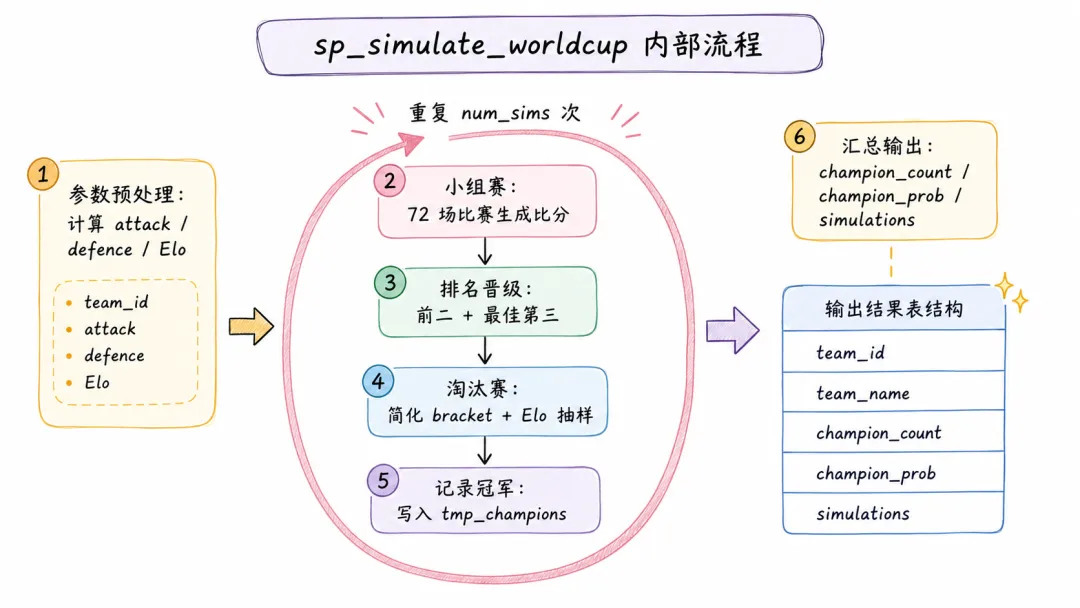
- Calculate team parameters from Elo ratings and season statistics.
- Generate group-stage scores with Poisson goal sampling.
- Rank groups and advance the top two teams plus the eight best third-placed teams.
- Sample knockout winners using Elo-based win probabilities and a simplified pairing rule.
- Record the champion for that run.
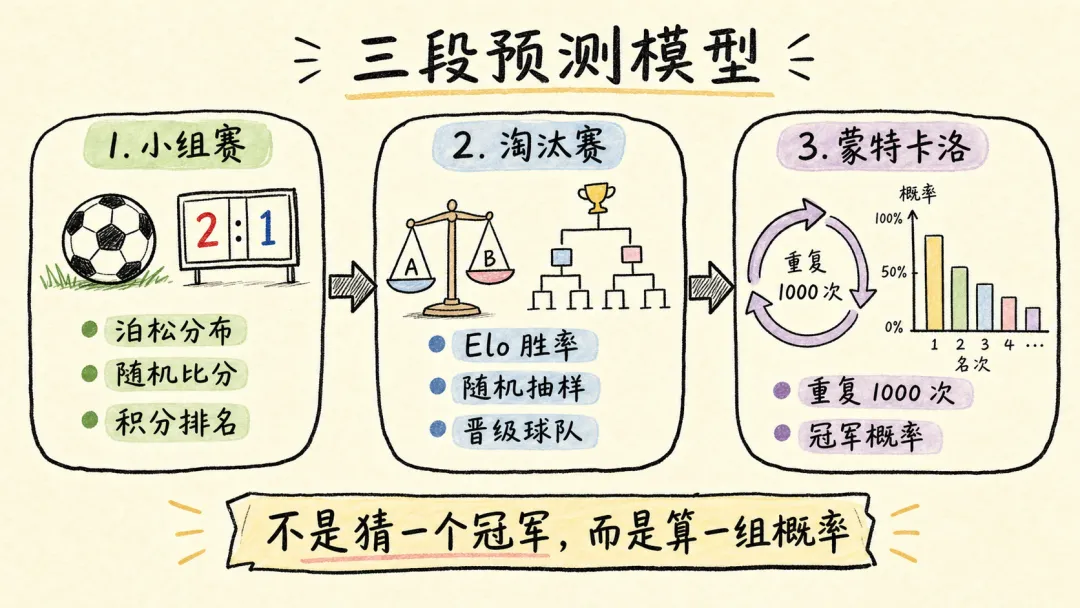
An outer loop calls the procedure repeatedly. In the reference run, it performs 1,000 simulations; more runs reduce Monte Carlo sampling noise but cannot correct model or data assumptions. A final aggregation query returns:
champion_count— how many simulated titles each team wonchampion_prob—champion_countdivided by total simulationssimulations— the number of Monte Carlo runs completed
Keeping data, random sampling, and aggregation in one database makes the experiment inspectable and repeatable. You can examine intermediate tables, adjust an Elo rating or scoring parameter, rerun the procedure, and compare result distributions without exporting data to another analytics tool.
Why run Monte Carlo World Cup simulation in seekdb?
The value of this exercise is not that seekdb can “predict” the future. It is that the database can execute the entire pipeline end to end:
1 | historical data → feature tables → match simulation → tournament state → probability summary |
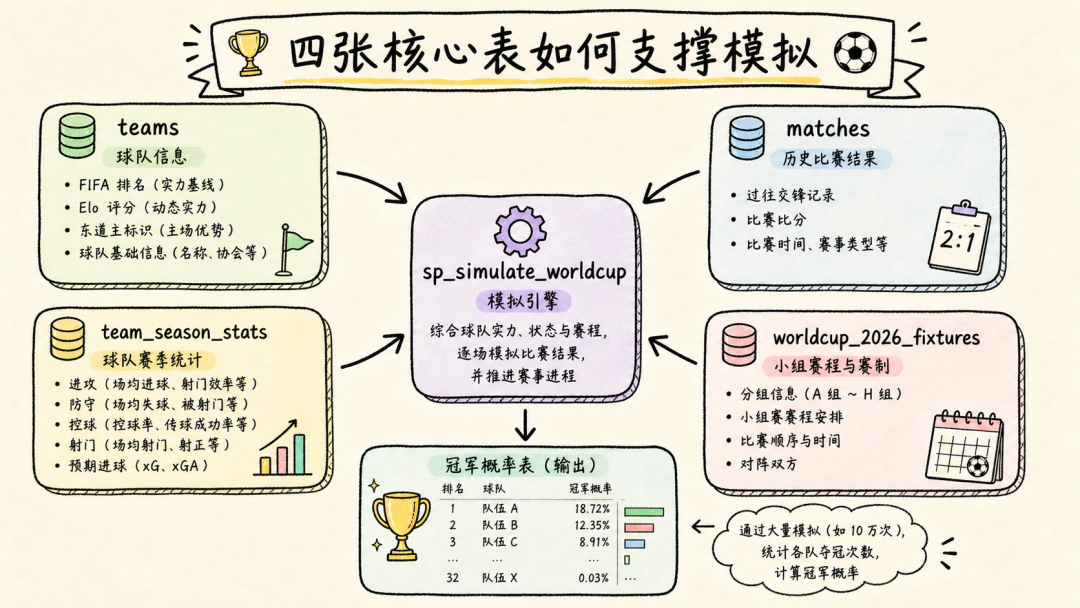
Co-locating computation with data avoids moving intermediate result sets between tools. The intermediate state is visible through SQL, making the implementation easier to inspect and extend. This does not imply that in-database SQL is the best execution environment for every simulation workload.
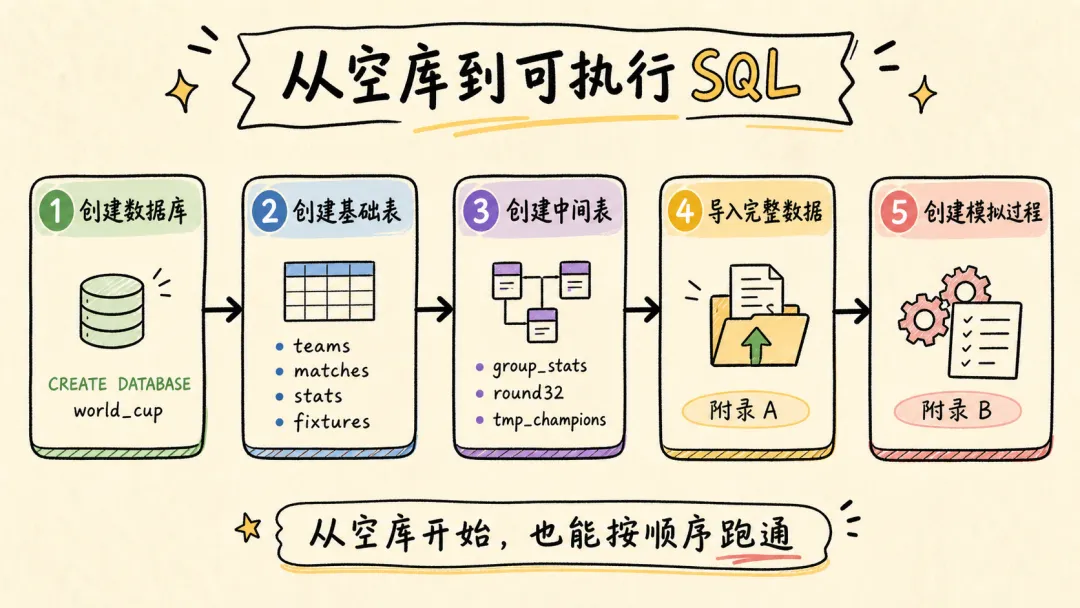
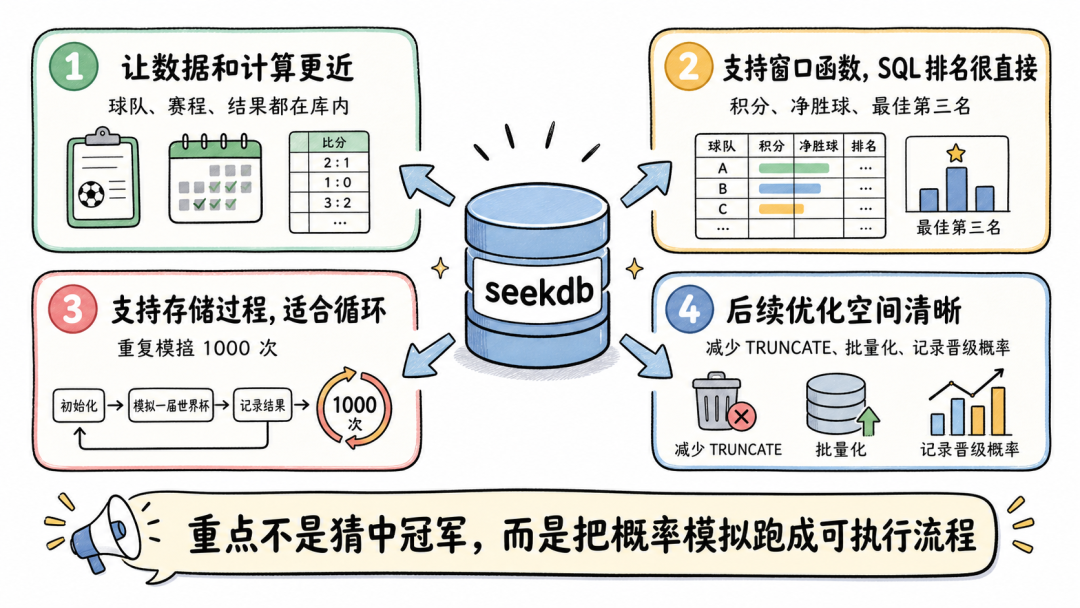
For AI and analytics teams, the pattern can extend beyond sports: capacity planning, reliability modeling, and scenario analysis can all benefit when data preparation, simulation state, and aggregation remain together. Whether an in-database implementation reduces operational complexity depends on the workload, scale, and team tooling.
Again, the championship frequencies produced by this demonstration illustrate what SQL can compute under explicit assumptions. They are not a real-world forecast or a recommendation to place bets.