Migrating from a Sharded MyCat Architecture to OceanBase | Lessons from Belle Fashion's Core Financial System Migration
Author: Lu Wenhao, Head of Database at Belle Fashion
#Belle Fashion Group (hereinafter “Belle”) is a leading large fashion footwear and apparel group in China. It owns 20+ footwear and apparel brands such as #BELLE, #TATA, and #TEENMIX, covering categories from high-end to mass fashion, functional, sportswear, and trendy. It has 8,000+ offline stores across 300+ cities. As the company that has ranked first in China’s fashion footwear market share for more than a decade, Belle has a well-developed offline sales network and has built a complete supply chain integrating production, supply, and sales — from raw materials to design to manufacturing and finally to retail.
Behind this supply chain, the group’s technology center coordinates the construction and operation of its business systems, including core areas such as retail, inventory, and finance. To remove the constraints that underlying technical bottlenecks place on business development, the technology center continually iterates its technical solutions. As one of the core systems, the financial system just underwent a “heart transplant,” migrating its database solution from a sharded MyCat architecture to OceanBase, achieving a “double win” of higher performance and lower cost.
The Results First: 30x Performance Improvement, Cost Reduction up to 18x the Original Architecture
Key-function efficiency improved 30x.
Take the cost-accounting function of the financial system as an example: its overall runtime is relatively long. It originally took 10 hours on MyCat, but after migrating to OceanBase, it takes only 20 minutes — a 30x performance improvement. As the monitoring data shows (see Figure 1), the original system kept the disk under sustained high load between 02:00 and 12:00 daily; whereas in the OceanBase environment, the same task completes within 20 minutes and the load quickly subsides. The efficiency gain is significant and has earned high praise from the R&D team.
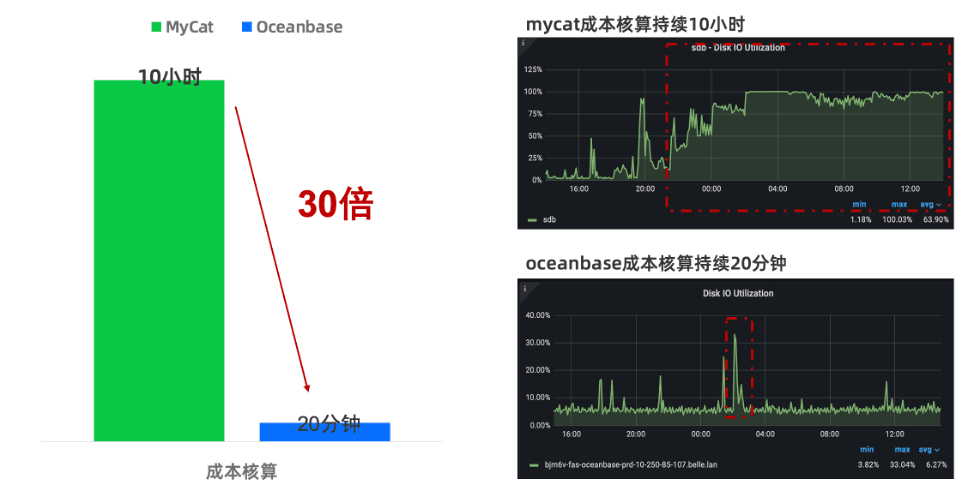
Figure 1 Performance monitoring data before and after the database migration
Storage cost down 96.7%, hardware cost down 59.4%.
The original MyCat data occupied 20.3 TB in total; after migrating to OceanBase, it occupied only 1.3 TB — an overall compression ratio as high as 96.7%. The compression gains came mainly from two sources: one is OceanBase’s own high compression ratio; the other is that the original MyCat architecture had a lot of data redundancy, which was released after consolidation by OceanBase’s integrated compute-storage architecture.
In addition, the original MyCat environment was deployed across 37 servers in total; after migrating to OceanBase, only 10 servers were needed to support the entire business, cutting the server cost for this business from RMB 2.07 million to RMB 840,000 — a 59.4% reduction in hardware cost.
The reason such results were achievable is twofold. On one hand, the redundancy and performance bottlenecks of the original architecture constrained the business system, and the new database solution not only removed those bottlenecks but also brought greater gains. On the other hand, it comes down to correct migration and technical optimization, which we describe below as we share our migration experience.
Experience Summary: A Three-Step MyCat-to-OceanBase Switch
Background of the Switch
Belle’s business systems originally used the #MyCat middleware uniformly to implement sharding, planning shard granularity by region (such as South China and North China), ensuring that the vast majority of store-level inventory operations converge to a single shard for execution, thereby significantly reducing distributed transactions.
Figure 2 shows the business’s original MyCat-based sharding architecture, using a one-primary, two-replica configuration. The primary data center is in Beijing, and the two replica nodes are in the Ulanqab data center serving as a remote disaster-recovery data center. Business data is divided into different regional shards by region. Data access for each region is dispatched through MyCat to the corresponding regional shard for execution. To avoid distributed transactions, the business layer tries its best to ensure that each data access targets only one specific region.
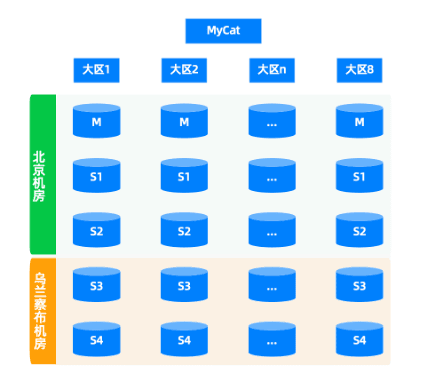
Figure 2 MyCat-based sharding architecture
As the business evolved and both business data and business needs grew, the sharded MyCat architecture gradually exposed three main categories of problems.
The first category is the difficulty of data migration. When the business needed to merge or adjust regions, cross-database data relocation was required. The entire process involved complex scripts and a small rollback window — high risk and long duration.
The second category is MyCat’s functional deficiencies affecting the business. MyCat provides only basic routing capabilities, with limited support for complex SQL (multi-table joins, subqueries, aggregate statistics) and distributed transactions. Because queries in modules such as finance are fairly complex, sharded tables had to be changed into global tables, requiring application adaptation, which caused data redundancy and increased maintenance cost.
The third category is poor scalability. Horizontal scaling required re-dividing regions and triggering another full data migration. When performance bottlenecks appeared, the only option was to rely on vertical hardware upgrades, with no way to quickly resolve them through horizontal scaling.
To replace MyCat and resolve its inherent pain points, the technology center narrowed its selection scope to native distributed databases and defined two core demands: first, high availability with zero data loss; second, online elastic scaling without downtime or data relocation.
After market research and multiple rounds of evaluation, Belle’s technology center ultimately chose OceanBase. The following uses the project of upgrading the core financial system from MyCat to OceanBase as an example, systematically reviewing the key practices in the database-replacement process. Regardless of which replacement plan is adopted, it must revolve around three core steps.
- Data flow: map the full data-flow chain and clarify where data comes from and where it goes.
- Data verification: ensure data correctness and validate accuracy and consistency.
- Compatibility and tuning: identify and address compatibility and performance problems.
Step 1: Data Flow
Under the MyCat Architecture
The upstream data-synchronization links are shown in Figure 3.
- Master data MySQL: distributes the group’s various common business data to each regional DB as global tables via MyCat.
- Financial application: other business systems also synchronize data to MyCat. Because the partitions corresponding to different businesses are identical, data synchronization between different businesses is done via a one-to-one DB correspondence.
- Synchronization tool: the red links represent data-synchronization links, uniformly using Alibaba’s open-source tool Otter.
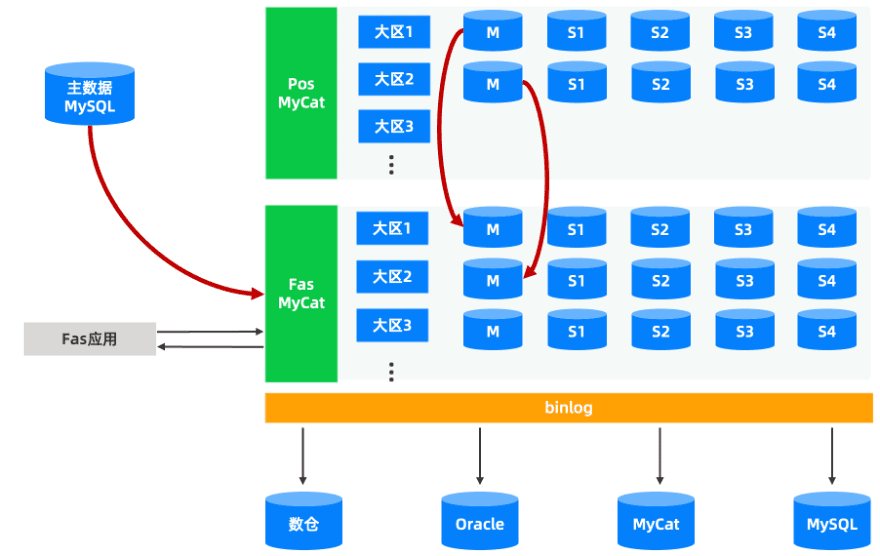
Figure 3 Upstream data-synchronization links under the MyCat architecture
The downstream data-synchronization links are shown in Figure 4.
- Data warehouse: ingestion is achieved via Binlog extraction.
- Oracle: the financial system’s business data needs to be synchronized to #Oracle for reporting analysis.
- Synchronization tool: the red links represent data-synchronization links, uniformly using Alibaba’s open-source tool Otter.
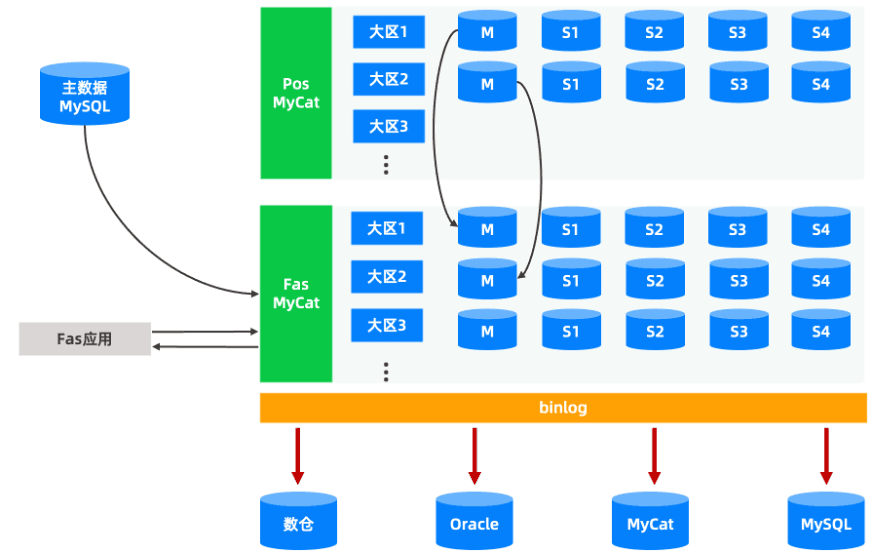
Figure 4 Downstream data-synchronization links under the MyCat architecture
Under the OceanBase Architecture
If OceanBase replaces MyCat, can the existing data links still flow normally after going live?
On the upstream side (see Figure 5), the link with OceanBase as the target is relatively simple to implement — you only need to modify the target-side configuration to achieve data synchronization, and the old approach can be maintained.
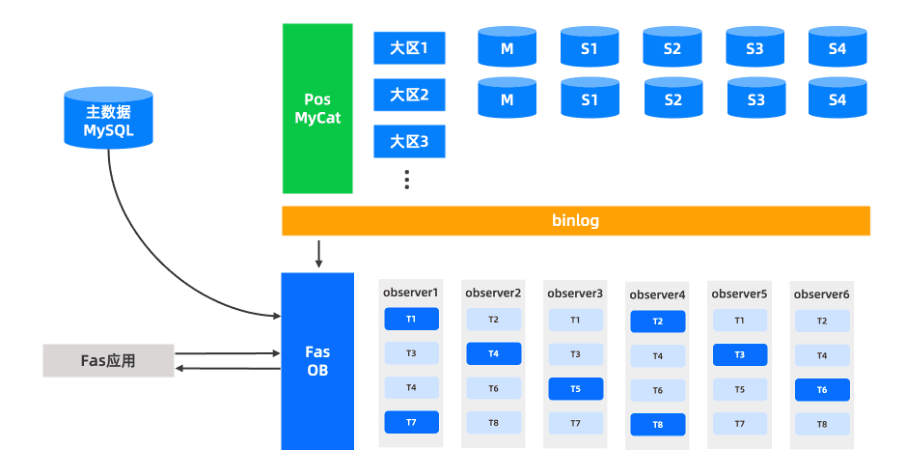
Figure 5 Upstream data-synchronization links under the OceanBase architecture
Compared with the upstream, the downstream replacement is more complex. Previously, under the MyCat architecture, data synchronization was based on Binlog; if replaced with OceanBase, it cannot directly provide Binlog logs for downstream consumption. So how do we synchronize data downstream? There are two solutions (see Figure 6).
Solution 1: Deploy OceanBase Binlog Service on the Fas OceanBase to generate Binlog. For the entire data chain, this can basically run the whole chain through Otter, with the best compatibility and the smallest changes. But there are also some problems. For example, MyCat has eight MySQL shards, equivalent to eight threads collecting data from eight database instances. Since OceanBase Binlog Service operates at the tenant granularity, whether producing or consuming Binlog, only one thread can handle it. During business peaks, there may be a performance bottleneck.
Solution 2: OMS delivers data changes to Kafka. With this solution, the data warehouse can quickly extract data with relatively low latency, meeting real-time reporting and other high-timeliness business needs, solving the performance problem of Solution 1. At the same time, because the data warehouse and some data need to be synchronized to Oracle with extremely high real-time requirements, the OMS-to-Kafka link must also be used. To this end, a data-synchronization tool needs to be developed to handle the downstream data flow from Kafka to Oracle.
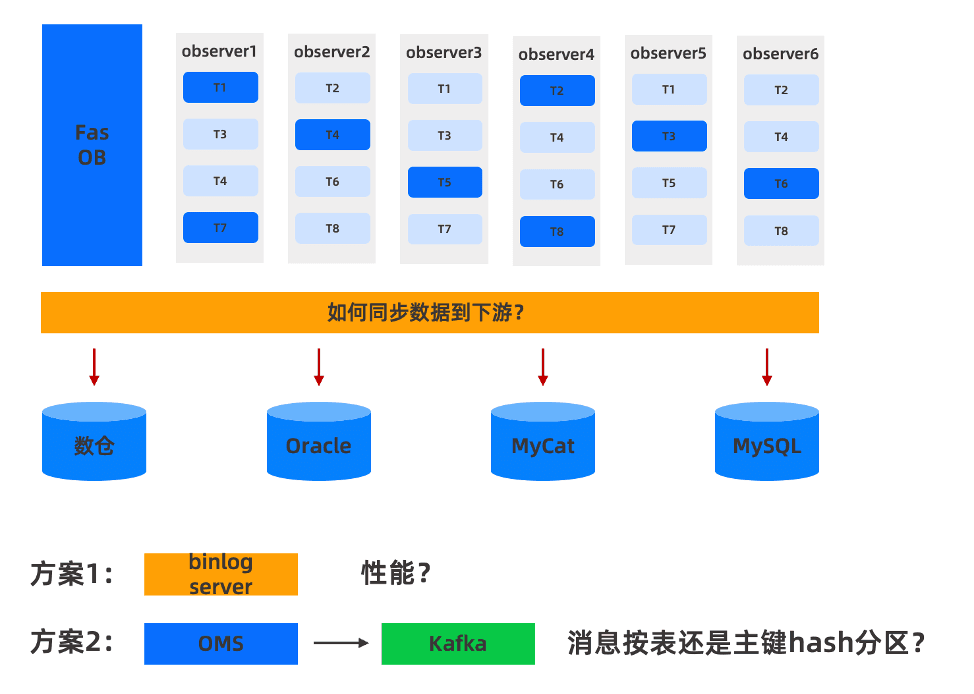
Figure 6 The two approaches for synchronizing data downstream after replacing MyCat with OceanBase
Regarding our experience using OMS, we summarized several problems and considerations encountered in practice.
First, OMS insertion conflicts are printed in the log but do not affect replication.
When OMS inserts data and detects a data conflict, it records the relevant information in the log without interrupting the replication flow. This means that, for example, in a sharded scenario, even if there is a component conflict, OceanBase’s link through OMS will keep running and will not be interrupted because of it. For this, we need to strengthen the data-verification mechanism in subsequent work to promptly detect and handle potential data-consistency problems.
Second, for OMS versions before V4.2.5.2, watch out for the replication of fields exceeding 4K.
In OMS versions before 4.2.5.2, for LOB fields exceeding 4K stored out-of-row, OBCDC may not emit the pre-image of the LOB column when a DML is executed, causing downstream data inconsistency. Specifically, if a row of data does not modify that large field, OMS sets the field content to empty when delivering the change message to Kafka. This behavior is unfriendly to data-synchronization tools that generally rely on full-image replication. For example, even modifying only the update time may cause a field larger than 4K to be set to empty, affecting the integrity of downstream data. It is recommended to use version 4.2.5.2 or later (OMS 4.2.5.2 already resolved this problem).
Third, when OMS delivers data changes to Kafka, hashing offers the best consumption performance, but you must consider whether unique keys are involved.
OMS supports two ways of delivering data changes: one is by table granularity, and the other is by primary-key hash partition granularity. From the consumer’s perspective, primary-key hash partitioning offers the best performance. But you need to consider the unique-key problem that exists on the target side in certain scenarios, which may cause data loss.
Take a scenario we encountered as an example: suppose there is a table (tab1) with a primary key (id) and a unique key (uniq_col), and we perform the following three steps on this table in sequence:
- Insert a row: insert into tab1 values(1,’a’);
- Delete by unique key: delete tab1 where unique_col = ‘a’;
- Insert a row with ID 2: insert into tab1 values(2,’a’);
As shown in Figure 7, when the above changes are delivered to Kafka via OMS, if ID is used as the hash value, (1,’a’) and (2,’a’) very likely will not be distributed to the same Partition. In Partition1 there are both an insert and a delete, while in Partition2 there is only one insert record.
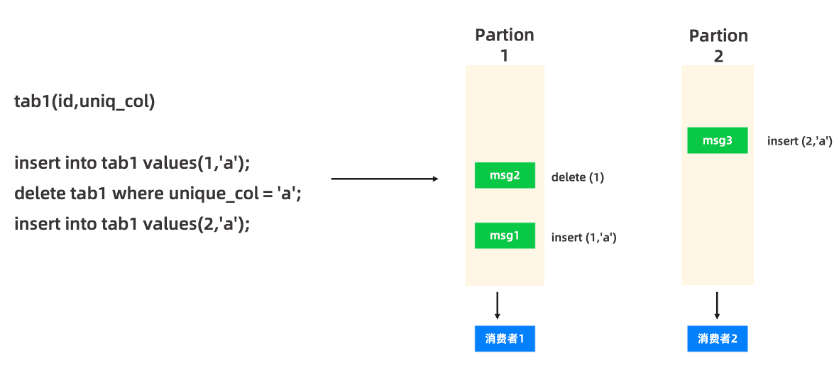
Figure 7 Possible outcomes when OMS delivers data changes to Kafka
Because downstream consumers face various situations when consuming messages and may not process them in statement-execution order, whether the downstream data synchronization uses the insert into mode or the insert into … on duplicate update… mode, the loss of the (2,’a’) data may occur.
If the downstream data synchronization uses the insert into mode, consuming in the order shown in Figure 8 — first inserting (1,’a’), then continuing to consume msg3 to insert (2,’a’), at which point the conflict on column a causes it not to be executed, and finally consuming msg2 — leads to the loss of the (2,’a’) data.

Figure 8 Downstream data synchronization using the insert into mode
If the downstream data synchronization uses the insert into … on duplicate update… mode (see Figure 9), first inserting msg3, i.e. (2,’a’), then, based on the insert into … on duplicate update mode, when consuming msg1, once a conflict appears on column a, the value of column a is updated to 1, and finally consuming msg2 leads to the loss of the (2,’a’) data.

Figure 9 Downstream data synchronization using the insert into … on duplicate update… mode
The problem that may occur when consuming the above OMS primary-key-hash-partition delivery to Kafka is essentially caused by the fact that, in primary-key hash-partition mode, different Partitions concurrently modify the same row while a unique key is superimposed. Therefore, in the second solution above — where OMS delivers data changes to Kafka under the OceanBase architecture — whether messages are partitioned by table or by primary-key hash depends on two factors: first, whether there is a need for high performance; second, if the downstream table has no unique key, primary-key hash partitioning can also be used.
Reverse Synchronization
Figure 10 shows the data links before and after the business switch. Links of different colors represent different data-transfer tools: red links represent Otter, blue links represent OMS, green links represent Belle’s in-house data-synchronization tool SQLapplier, and black links represent other tools.
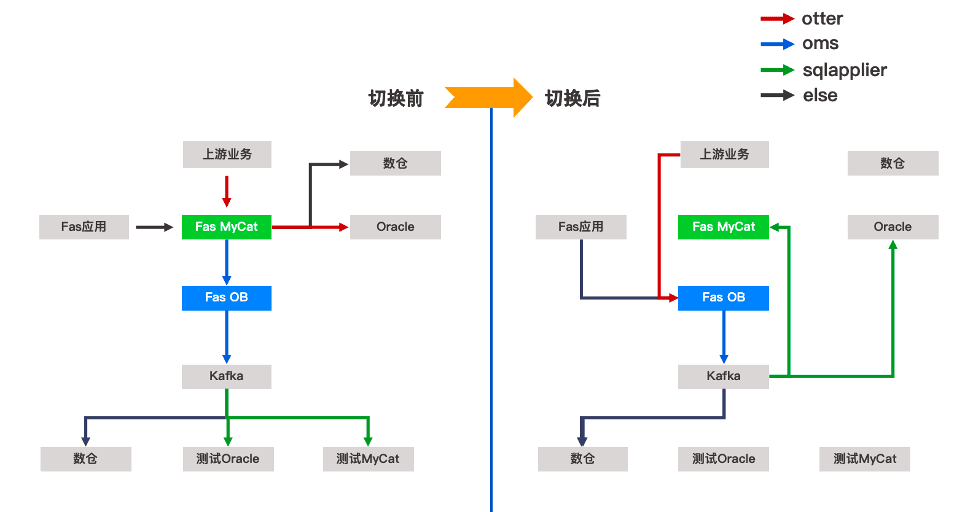
Figure 10 Data links before and after the business switch
Before the switch, business data is synchronized to OceanBase via OMS, and OceanBase delivers it to Kafka via OMS. Before going live, data-synchronization testing must be done, synchronizing data to the test Oracle and test MyCat via Kafka, continuously validating the synchronization tools’ performance and functional compatibility.
The data warehouse can be validated and switched in advance. During the business switch, the application and the upstream business synchronization need to be paused, at which point MyCat and OceanBase are in a relatively static state. Then OMS needs to be stopped, Kafka reverse-synchronized to MyCat and Oracle, and the upstream business pointed to OceanBase — completing the switch. The significance of reverse synchronization is that if any problem arises in the early phase of the switch, you can switch back in time, improving the system’s disaster-recovery capability.
Step 2: Data Verification
After the data flow is complete, data verification is generally required. For single-database migration, OMS can be used directly for data verification, and during repeated verification, correction data can be generated based on the inconsistencies. If the source is MyCat, you can set up verification with MyCat as the source and OceanBase as the target. But because Belle uses many Otter tools and also has some heterogeneous-database verification needs for MySQL and Oracle, it used an in-house tool (see Figure 11).
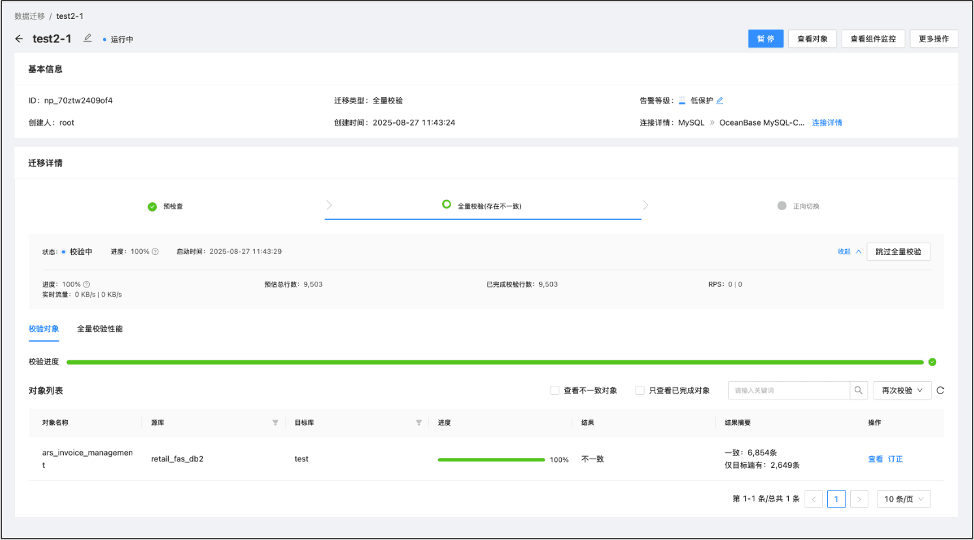
Figure 11 Using the in-house tool for data verification
Basic Principle of Data Verification
Take Figure 12 as an example: to verify that a corresponding row of data is consistent on the target side, each field is concatenated into a string and then run through a crc32 check. If the crc32 of both sides matches, the source and target data are consistent. If you make a simple modification to one side’s data (such as adding a space), the data will change greatly. For an entire table, it is split into multiple chunks by a certain number of rows, and crc32 comparison between target and source is done at the chunk granularity. If an inconsistency appears, a retry is performed; if the data is still inconsistent after multiple retries, the chunk is split; and if it is still inconsistent after multiple splits, it is ultimately converted to the row-data string described above for verification.
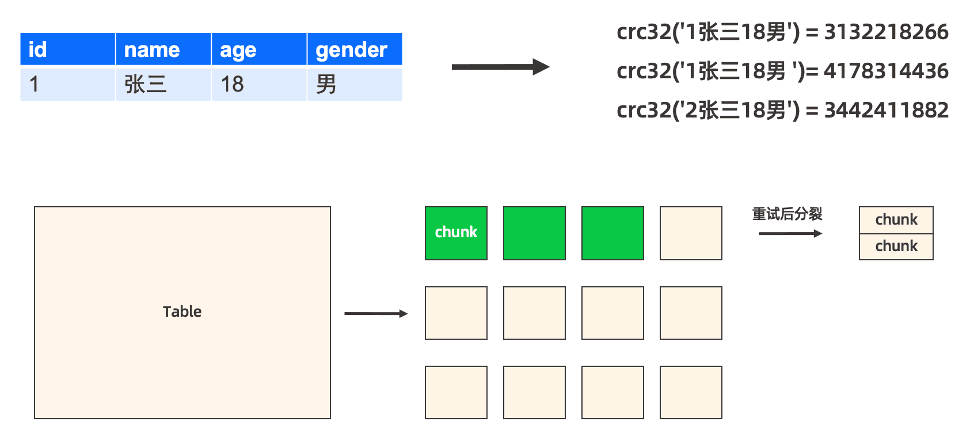
Figure 12 An example of the method for verifying that corresponding row data is consistent on the target side
Summary of Data-Verification Problems
Figure 13 shows the data-verification process with OceanBase as the source and Oracle as the target on the platform. During our testing, we found a total of 4 problems.
- Abnormal business data. Because MyCat has weak constraints, over long use and with operations such as change and migration of data, some historical problems may be left behind, such as duplicate IDs.
- Data loss caused by differences in the scope of unique-key constraints. MyCat’s unique constraint can only constrain within the DB-partition granularity, whereas in OceanBase it is a global constraint. This difference can also cause data loss.
- Data loss from Kafka hash-partition consumption and downstream unique-key constraints.
- Data loss for 4K large fields before OBServer V4.2.5.2.
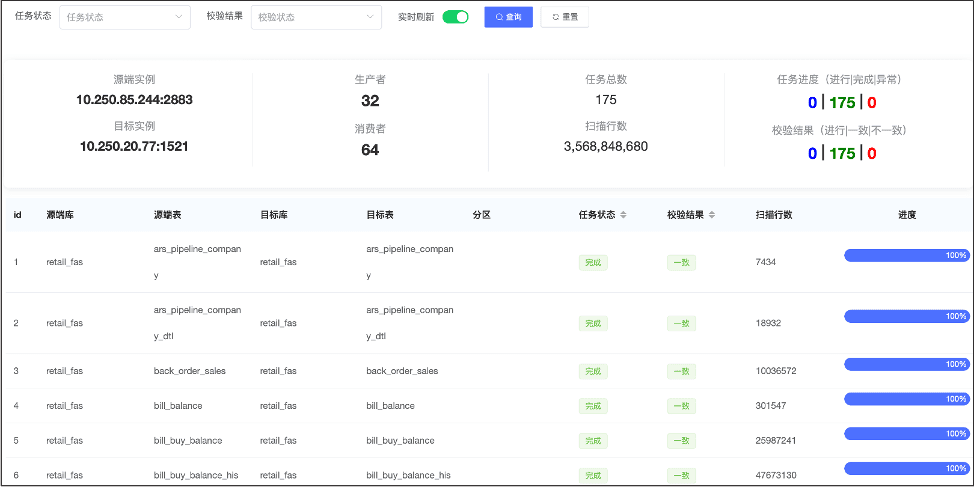
Figure 13 The data-verification process with OceanBase as the source and Oracle as the target on the platform
Data verification covers data governance, data correctness, and data-consistency verification. Resolving existing data anomalies before going live is a very important task.
Step 3: SQL Compatibility and Performance Testing
After the data links are established and data verification is complete, the next thing to resolve is SQL compatibility and performance — for example, how to compare the database performance difference between MyCat and OceanBase, and whether OceanBase’s performance can meet our business needs. For these needs, a straightforward method is: implement all the SQL from MyCat in OceanBase, which fully tests compatibility issues and performance.
To this end, we developed a traffic-replay feature. As shown in Figure 14, full logs are collected across each DB through the database management platform, then parsed into CSV format. Finally, integrating all the CSV files forms a parse report, used to analyze the overall SQL distribution, DDL, DML, and so on at the cluster level. After replaying the CSV against MyCat and OceanBase, a replay comparison report is produced.
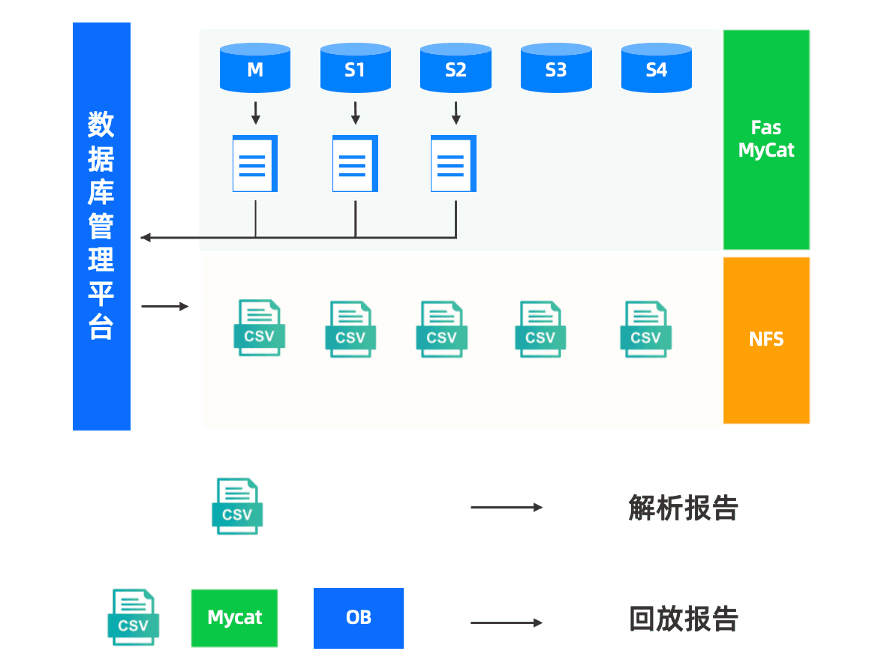
Figure 14 The execution process of traffic replay
Seeing this process, you may have two questions:
- Why use full logs? The benefit of full logs is that the global variable is easy to toggle — if you find performance pressure, you can choose to turn it off.
- Why use CSV format? This is for compatibility considerations. For example, OceanBase can currently convert SQL into CSV format, and going forward you can directly pull SQL from OceanBase’s SQL Audit and save it in CSV format, which can likewise run through the replay flow.
Replay Report
The statistics in the replay report (see Figure 15) include: parameterizing all replayed SQL into templates to generate corresponding SQL IDs; the tables each SQL uses; and, for each SQL ID, the minimum response time, maximum response time, average response time, number of executions, number of errors, and the corresponding SQL.
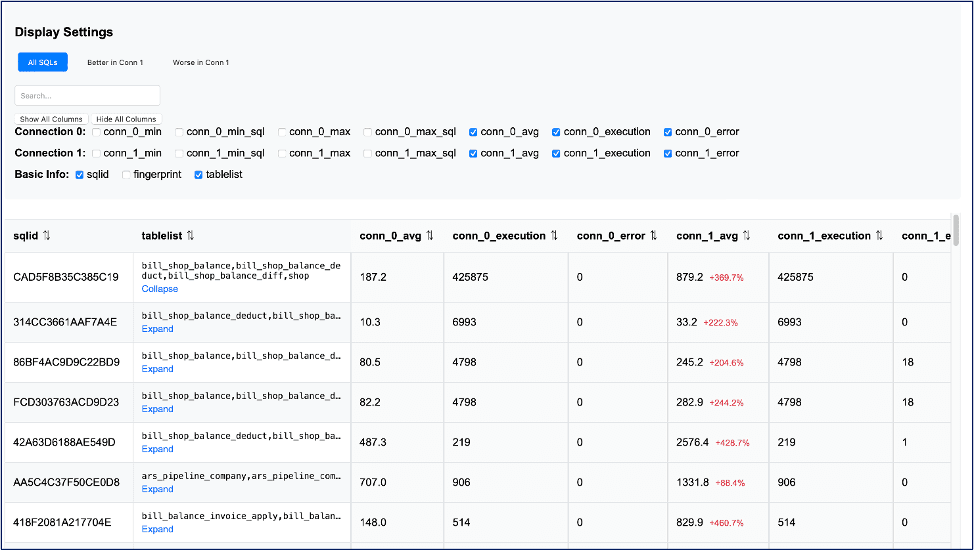
Figure 15 The statistics in the replay report
Through the replay report, we can perform compatibility analysis, determine the optimization scope and task assignment, and continuously replay, thereby improving work efficiency.
Compatibility analysis. By comparing the execution results of the source and target, we check whether compatibility errors exist. For example, if the report shows errors, we need to further verify whether the cause is a timeout or whether the SQL statement itself is incompatible, thereby accurately locating the SQL statement’s compatibility problem.
Determining the optimization scope. The replay report helps us determine the scope of SQL statements that need optimization. Because the report generates a large number of SQL statements, not all of them need optimization. The report provides data such as each SQL statement’s average response time and execution count, through which SQL performance can be assessed to clarify the optimization scope.
Task assignment. After determining the optimization scope, how to reasonably assign tasks becomes a key issue. Initially, task assignment could be fairly arbitrary, directly assigned by SQL ID, but in the weekly slow-query review meetings we gradually found that this assignment method could lead to low efficiency. To improve this, we used the previously collected table-group information (tablelist) and assigned tasks by table-group granularity, which not only improved the efficiency of slow-query governance but also avoided duplicate work.
Continuous replay. Because the replay report is replayed multiple times — especially in systems with large traffic variation, such as the financial system whose traffic can differ greatly between the start and end of the month — we continuously capture traffic from the start to the end of the month and replay it multiple times. However, as the number of reports increases, horizontal comparison becomes increasingly inconvenient. To solve this, we integrated the reports into the platform and, using SQL ID as the key element, chained together the reports of each replay for easy analysis and comparison.
Continuous SQL Governance and Follow-up
Figure 16 is a screenshot of our platform’s continuous SQL governance and follow-up panel, which can show the change of each SQL in each round of replay. Each DBA only needs to focus on the SQL they are responsible for. For example, for the SQL shown in the figure, after tuning by table group, we can see its maximum response time and other metrics drop significantly, proving that the efficiency gains the replay report brings to SQL diagnosis and governance are very intuitive.
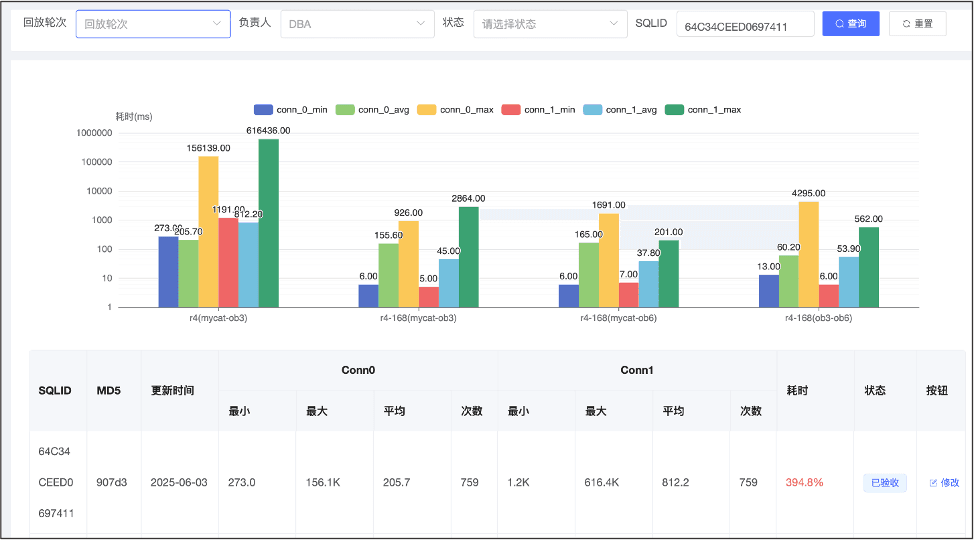
Figure 16 The platform’s continuous SQL governance and follow-up panel
In addition, it is worth mentioning that OCP has a very practical feature: it can restore data to a specific point in time. During stress testing and traffic replay, DML operations may be performed on the data, modifying it. In such cases, OCP can quickly restore the data to a copy from a certain point in time, making it easy for us to put the data to use immediately. After use, it can be deleted. We consider this feature extremely valuable.
SQL Problem Classification
During SQL governance and tuning, we found four problems in total.
Problem 1: Some SQL is incompatible.
When using SQL, we usually use “–” for comments at the end of an SQL statement. In MySQL this generally does not cause an error, but in OceanBase it did, and the R&D team modified it directly. It is worth affirming that, after replaying about 45,000 SQL IDs, this was the only incompatibility problem found, which shows that OceanBase’s syntax compatibility with MySQL 5.7 is very high, requiring essentially no excessive effort on the compatibility front.
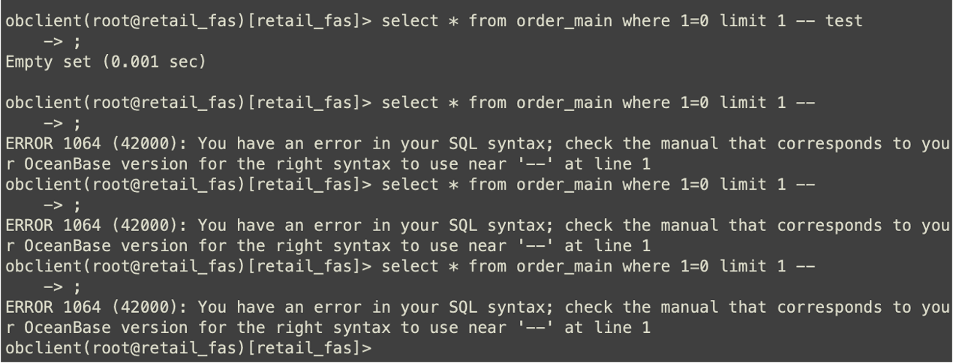
Figure 17 The incompatible SQL
Problem 2: High RPC cost.
When querying in a multi-group mode, if the SQL involves multiple OBServers, network overhead may increase, especially when processing large amounts of data, which can significantly reduce query efficiency. Solving this problem requires designing shard-table table groups or, for relatively stable master-data tables, designing replicated tables. In addition, to quickly determine whether it is an RPC problem, you can restore a single-primary environment, execute the SQL in it, and then compare performance with the multi-primary environment, effectively judging whether the problem is caused by RPC cost.
Problem 3: Partition pruning.
Partition pruning is another category of problem that takes a lot of time to tune. For example, in an order-by join query involving the DTL order-detail table that specifies a certain regional condition, in MyCat there is no condition like the one in the red box shown in Figure 18. This is because MyCat’s partitioning rules are identical, i.e. isolated at the physical level — the data is already within one region, so there is no need to specify the region. But in OceanBase, if this condition is removed, the om table can perform partition pruning normally, but the od table does not know it needs to operate within this region, so OceanBase requires this condition to be specified to ensure correct partition pruning. This is a very typical partition-pruning problem, whose root cause is that MySQL’s mechanism is imperfect in certain respects: SQL that was originally physically isolated becomes a single complete database in OceanBase, which requires us to make corresponding adjustments and optimizations in OceanBase.
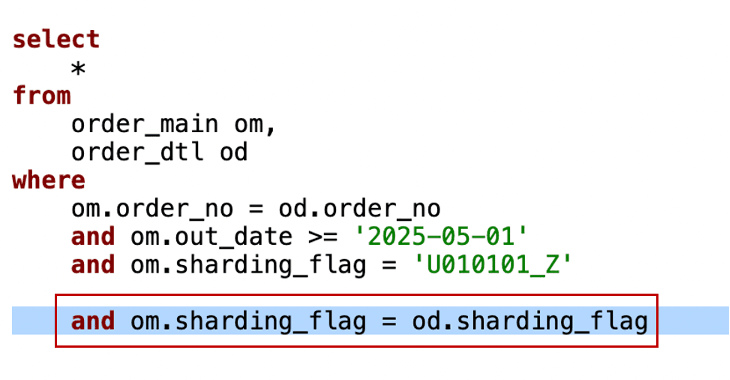
Figure 18 Adding the partition condition
Problem 4: Execution-plan problems.
Execution-plan problems involve several key parameters.
- The partition_index_dive_limit parameter is an SQL sampling-partition parameter that may affect execution-plan evaluation. If the sampling partition is small and the data is empty, it may cause a sampling misjudgment, affecting cost evaluation; it is recommended to increase the parameter according to actual needs.
- The “size parameter” problem refers to the same SQL reading greatly differing amounts of data under different variables yet using the same execution plan, which may cause performance problems. In this case you can use /_+USE_PLAN_CACHE(NONE)_/ to work around it, but this causes the SQL to be hard-parsed on every execution, with extra CPU overhead, so it needs to be weighed comprehensively before use.
- If there are too many in parameters, the hard-parse time may be too long. In this case you can appropriately adjust the _inlist_rewrite_threshold parameter so that once the in parameters reach a certain threshold, a rewrite can be performed to avoid the cost of hard parsing.
Problem Summary
In practice, we also encountered some other problems:
- Sub-optimal local rescan plan: a low-cost nlj plan was incorrectly pruned due to the local rescan rules, causing the SQL to ultimately use a high-cost, slow-executing hash join. This problem appeared in versions before OceanBase V4.2.5.3 and was fixed in OceanBase V4.2.5.3.
- When adjusting the tablegroup and manually triggering balancing, if there are empty partitions, the balancing computation may cause the task to hang. This problem appeared in OceanBase V4.2.5.3 and was fixed in OceanBase V4.2.5.4.
- For SQL involving replicated tables, under certain conditions the execution plan cannot be reused. This problem appeared in OceanBase V4.2.5.4 and was fixed in OceanBase V4.2.5.5.
Wrapping Up the Switch: Platform Adaptation
Internally, we use the Archery ticketing platform to manage and release SQL, and our existing databases such as MySQL are all using the Archery ticketing platform as well, so we planned to onboard OceanBase onto this platform.
Currently, OceanBase has integrated with the goInception project (https://github.com/whhe/goInception), enabling ticket rollback for OceanBase resource types — that is, completing SQL rollback in conjunction with OBServer.
When using the Archery platform to manage MySQL, we usually achieve Online DDL operations through approaches such as pt-osc or gh-ost. However, for OceanBase, such an approach may directly lock the table in an offline operation.
For this situation, the effect we want to achieve is: when submitting a ticket, both DBAs and R&D staff can identify whether an operation is Online or Offline. In the past, we relied on visual judgment. To improve this process, we added a small feature: when submitting a ticket, we run it once in OceanBase in the test environment and check whether the Table ID changes. If the Table ID changes, the operation is Offline; if it does not change, the operation is Online. The alert message is shown in Figure 19.
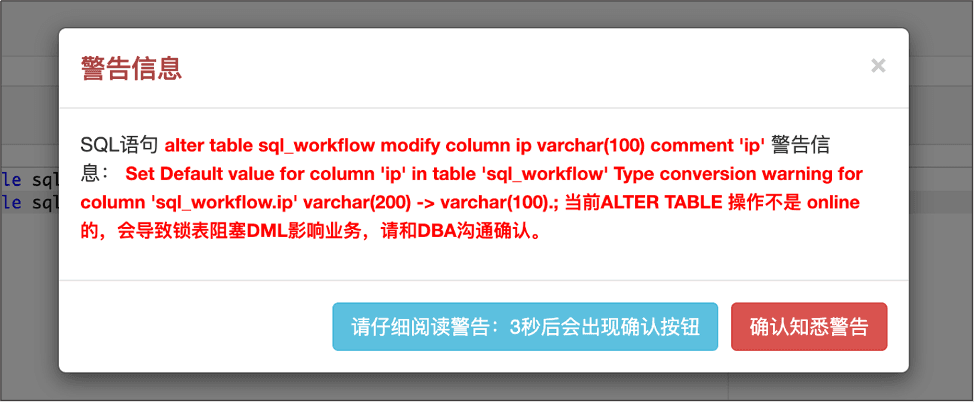
Figure 19 The alert message
Although this design is simple, its effect is significant. When submitting a ticket, R&D staff can tell at a glance whether the operation is online or offline, greatly improving work efficiency.
Why Did Belle’s Core System Choose OceanBase?
The above is a summary of Belle’s technical experience migrating its financial system from MyCat to OceanBase. Throughout this process, we are very grateful for the close attention and strong support of the OceanBase community team during our project testing and switch. So, why did we choose OceanBase rather than TiDB, PolarDB, or other open-source distributed databases?
The reasons can be summarized in three aspects.
The first is OceanBase’s technical advantages:
- Reliable. Paxos multi-replica mechanism, RPO=0, automatic failover, and zero data loss.
- Elastic. Standalone and distributed modes can be converted online; multi-tenant isolation; a high compression ratio reduces storage cost; capacity scales horizontally on demand, with no need for heavy upfront estimation.
- Unified. Native HTAP — the same engine simultaneously supports TP, AP, KV, and vector search — so introducing new workloads later requires no new technology stack.
- Easy to use. It provides a complete toolchain such as OCP, OMS, ODC, and OBAgent, significantly lowering the barriers to deployment, migration, monitoring, and operations.
The second is community activity. OceanBase maintains a style of being fully open-source and rapidly iterating, responding promptly to users’ problems, ensuring smooth technical-exchange channels for users. The community also frequently holds technical-exchange events and training courses, continually strengthening users’ ability to solve problems. Moreover, users can anticipate its release cadence.
The third is industry validation. OceanBase has been deployed at scale in demanding industries such as finance, telecom operators, and retail, and has stood the test of long-running core systems, with its stability fully proven by a large number of enterprises.
Welcome to join the open-source community Discord.